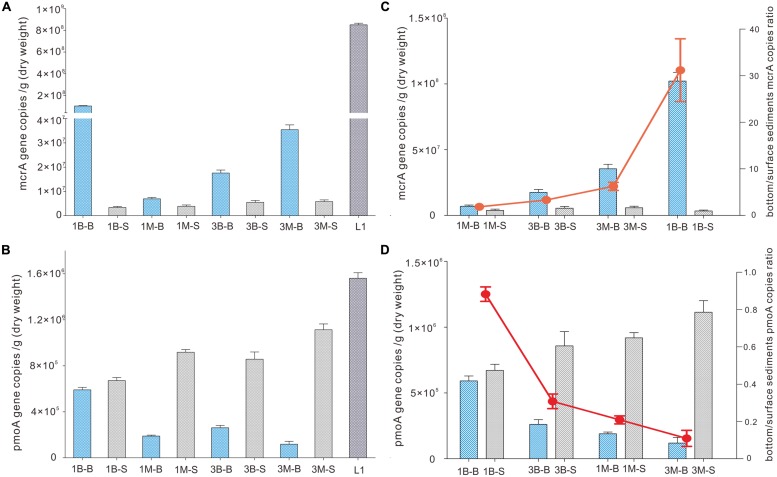
FIGURE 2.
Abundance of mcrA gene (A) and pmoA gene (B) of intertidal mudflat and mangrove sediment samples. Quantitative PCR gene copies in subsurface (bottom) and surface sediments are expressed in ratio as red dots (C,D). Error bards are vertical lines as standard deviations of three independent experiments.

