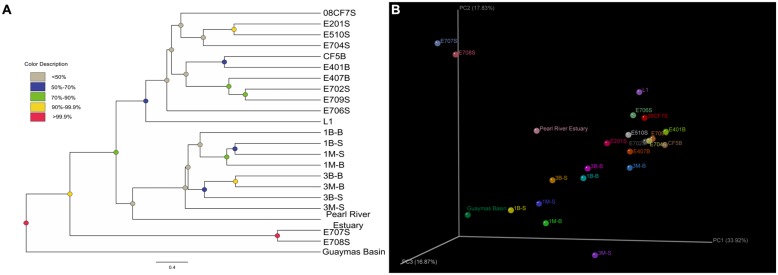
FIGURE 5.
(A) Weighted Jackknife sample cluster analysis was conducted by setting the minimum sample counts as 42, permutation numbers as 1000. Finally, the clustering results were shown in (A). Different node colors showed different confidence values of each cluster; (B) Weighted 3D PCoA ordination diagram was made by the Fast Unifrac online software package and then illuminated as 3D scatter plots diagram by KiNG 2.21 software (http://kinemage.biochem.duke.edu/software/king.php) with principal coordinate explanation valued labeled.

