
Figure 6.
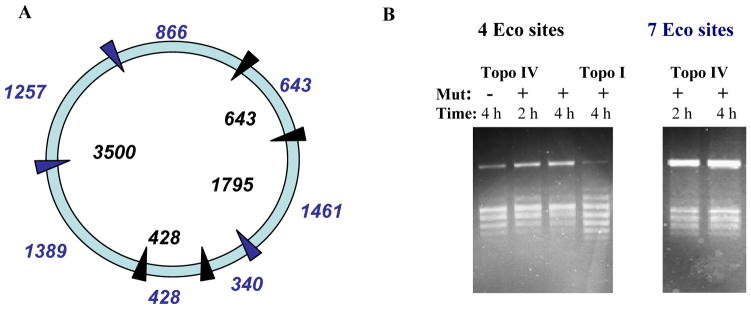
DNA relaxation in the presence of a ‘roadblock’. Relaxation of plasmid pKER3 (~6.5 kbp) containing 4 EcoRI sites (blue arrows) and 7 sites (blue and black arrows). A. Plasmid map. Numbers in black inside circle indicate distances (in bp) between sites in the 4-site plasmid; numbers in blue outside circle indicate distances (in bp) between sites in the 7-site plasmid. B. The gels show relaxation by topo I and IV of the 4-site and 7-site plasmids in the presence and absence of the EcoRI mutant protein (Mut). Gels were run under the same conditions as in Figure 2.