
Figure 2.
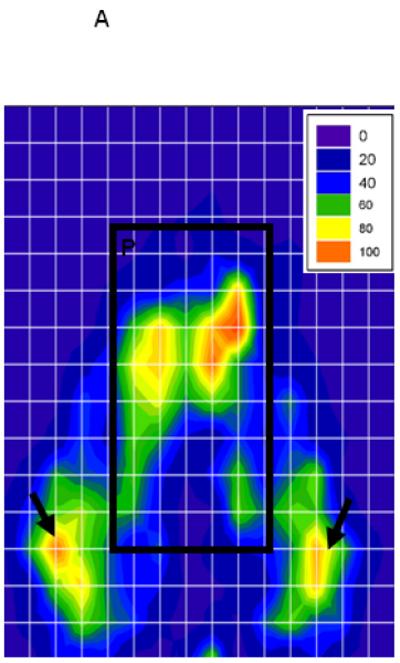
A. Representative image of the Pliance pressure map digital output after a typical riding session with a pressure scale in the upper right corner. Arrows indicate the presumed location of the ischial tuberosity pressure points. P designates the perineal region of the saddle. Pressure gradients are stratified by color maps representing scaled differences in pressure recorded in mmHg (12).
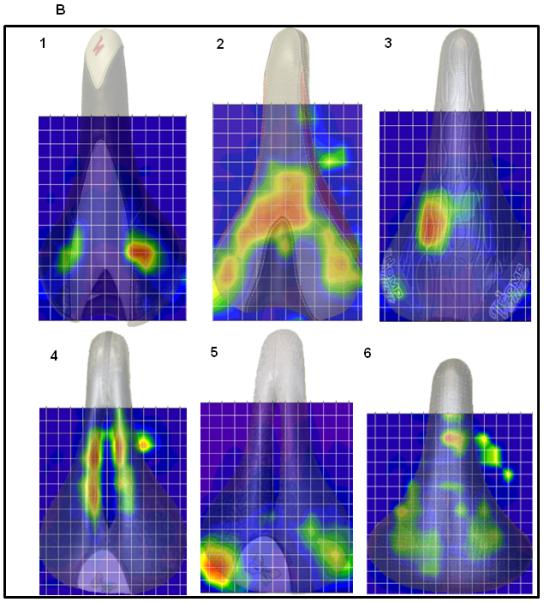
B. Reconstructed digital images of the saddles maps for women riding traditional (1-3,5) and cut-out (4-5) saddles using 2-dimentional overlays of rider saddles. 1. Pressure isolated to the bilateral ischial tuberosities (n =5); 2. Pressure more widely distributed along the posterior saddle and ischial tuberoscities (n=11); 3. Pressure isolated to the perineum (n=4); 4. Cut-out saddle with pressure in the perineal region, along the edges of the cut-out( n=15); 5. Cut-out saddle with pressure isolated to the bilateral ischial tuberosities (n=4). 6. Single wide saddle showing low pressure evenly distributed over the entire saddle (n =1);