
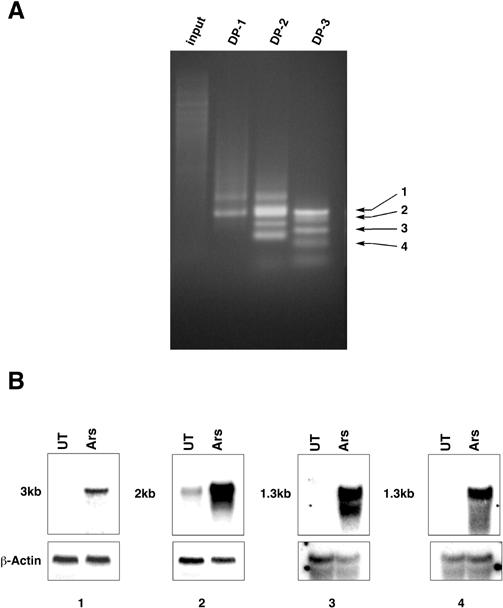
Fig 1. Identification of arsenite-inducible genes by representational difference analysis. (A) The input and “difference product” after each of 3 cycles of amplification were analyzed by gel electrophoresis and Ethidium Bromide staining (DP-1, DP-2, DP-3). The positions of the 4 (1–4) cDNAs isolated are indicated by arrows. (B) Northern blot analysis of RNA from untreated (UT) and arsenite-treated (Ars) MPTE cells probed with each of the 4 cDNAs. The size of the hybridizing RNA is indicated on the left. The filter was washed and subsequently hybridized with a β-actin cDNA as a control for RNA loading and integrity