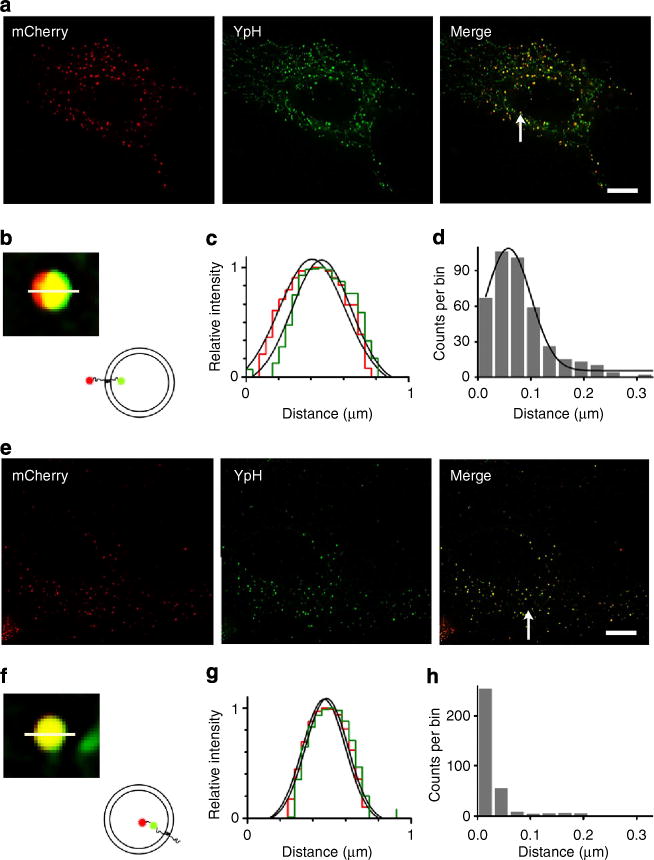
Figure 3. SIM measurements of the distance between fluorescent proteins appended to Sb2 termini.

a and e are the SIM images showing astrocytes transfected with mCherry-YSpH and YSpH-7aa-mCherry plasmids, respectively. Bar, 10mm. Merge panels show the overlay of the fluorescence of mCherry (red) and YpH (green) signals. b and f are close-up images of the mCherry and YpH pairs obtained from the images (Merge, arrow) in a and e respectively. The inset drawings indicate the orientation of YpH and mCherry decorating Sb2. c and g show relative fluorescence intensity profiles along the lines drawn in b and f. The histograms d and h show frequency distribution plots of the distances between the two fluorophores. (d) In case of mCherry-YSpH, the mean value of the distance (peak-to-peak, as in Fig. 2a) between YpH (intravesicular) and mCherry (cytoplasmic) is 57±1 nm (mean±s.e.m.) (R2 = 0.98, n= 403 vesicles, 7 cells; significantly different than zero, P<0.001; ANOVA). To measure the peak-to-peak distance, we fitted Gaussian curves using Equation 1. (h) In the case of YSpH-7aa-mCherry, the mean distance between two fluorophores juxta-positioned (spacing provided by a 7-aa linker) in the vesicular lumen is negligible (0±5 nm; n = 338 vesicles, 6 cells).
