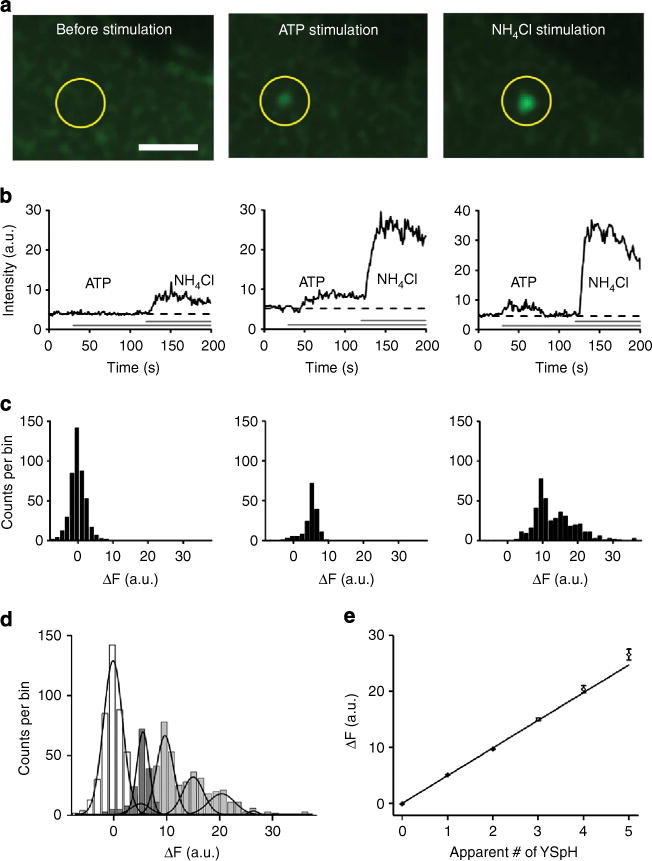
Figure 5. Stimulation of YSpH-labelled vesicles by ATP and NH4Cl reveals the number of YSpH molecules present on a single astrocytic vesicle.

(a) Time series frames of a representative YSpH-positive vesicle (circle) recorded by CLSM before and after successive stimulations with ATP and NH4Cl. Bar, 1 mm. (b) Examples of time-dependent changes in the fluorescence intensity of individual vesicles: left panel, ATP failed to evoke an increase in fluorescence intensity, however, NH4Cl elicited an increase; middle panel, application of ATP elicited a sustained increase in fluorescence intensity that was augmented by NH4Cl; and right panel, ATP elicited a transient increase in fluorescence intensity, which was followed with NH4Cl-elicited increase. Horizontal grey bars indicate the timing of ATP/NH4Cl applications. (c) Amplitude distributions of the change in YSpH fluorescence intensity (ΔF) recorded in nine astrocytes before and after stimulations (bin width =1.5 a.u.). Left panel, the change in YSpH intensity plot represents a background, which was obtained by monitoring changes in YSpH intensity before and after addition (at 30 s for 10 s) of ATP (bottom horizontal line) in recordings where ATP failed to elicit a significant increase in YSpH. Middle panel, after ATP, and, right panel, subsequent NH4Cl applications, the intensity distribution incrementally shifts to the right as vesicles alkalinize due to the pore formation (ATP) and subsequent chemical alkalinization (NH4Cl), respectively. (d) Combined plot of the change in YSpH intensity distributions for all vesicles (n = 1,045) from nine astrocytes: background (white) and after stimulation with ATP (dark grey) and NH4Cl (light grey). The Gaussian curves are fitted by keeping the s.d. as determined in the background shown in left panel and using Equation 1 (where x = ΔF (a.u.), for fitting parameters see Table 1). (e) The peaks of the Gaussian fits of different modes of intensities (obtained in d) are plotted as a function of modes, that is, number of YSpH packets; the relationship can be described using a liner regression in the form: ΔF (a.u.) = (4.95 ± 0.04) × apparent # of YSpH+(−0.02 ± 0.05), where # is the number or multiples of YSpH molecules (R2 = 0.997; significantly different from zero, P< 0.001; ANOVA).
