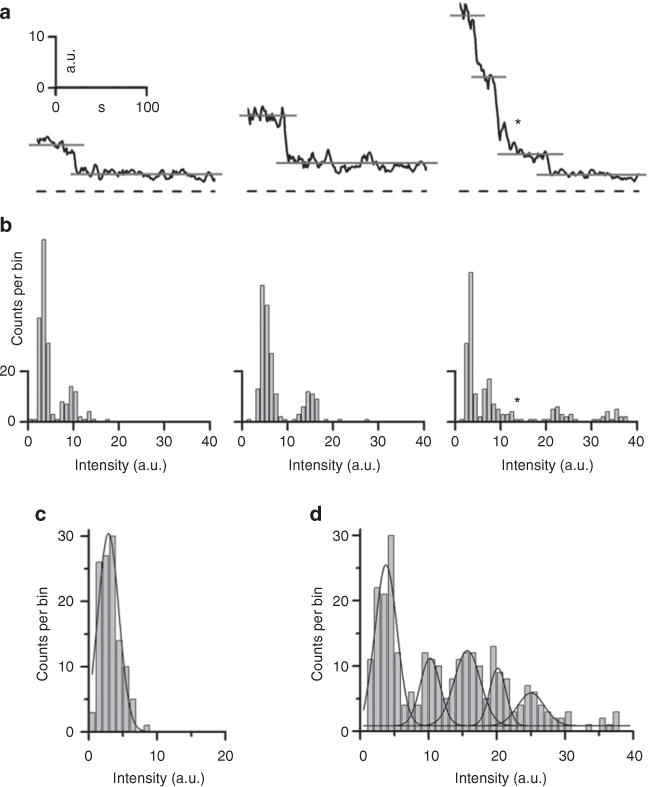
Figure 6. Photobleaching of NH4Cl-alkalinized YSpH-laden vesicles confirms the number of YSpH molecules present on a single astrocytic vesicle.

(a) Examples of time-dependent changes in the fluorescence intensity signals of individual vesicles: left panel, a single step decrease in the YpH fluorescence, middle panel, a single step decrease in the YpH fluorescence with double amplitude, compared with the event shown in the left panel, and, right panel, multiple step decreases in YpH fluorescence with three discrete steps, ‘*’ denotes another step decrease, which according to frequency plot does not represent a discrete step, but rather belongs to the distribution of the final discrete step. Dashed lines represent the baseline (zero-line) and grey lines show the levels of YpH fluorescence signals at discrete steps. (b) The respective distributions of the fluorescence intensity amplitudes of signals shown in the panel a. The first peak in amplitude plots denotes the lowest intensity observed. (c) The intensity distribution of the background, which was obtained by measuring the fluorescence intensity of the vesicle surroundings after 180 s of bleaching (R2 = 0.95; n = 108 events; bin width = 1.5 a.u.). (d) Fluorescence intensity distribution of YSpH-labelled vesicles after bleaching (R2 = 0.91; n = 277 vesicles; bin width = 1.5 a.u.). The Gaussian curves are fitted by using Equation 1 (× = Intensity (a.u.); see fitting parameters in Table 2).
