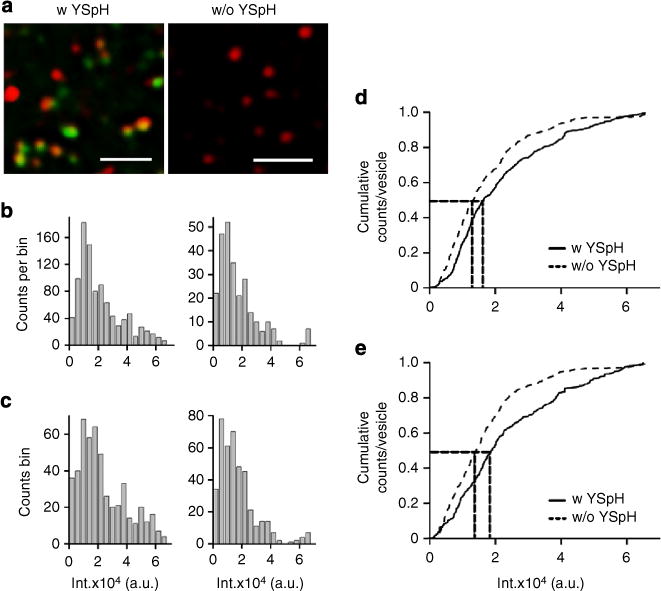
Figure 7. Quantification of the ratio between the number of YSpH and endogenous Sb2 molecules in astrocytic vesicles.

(a) Left fluorescent micrograph shows vesicles in cells transfected by YSpH and labelled by the Atto red dye (note that not all vesicles are labelled by both fluorophores), whereas the right panel shows vesicles in astrocytes labelled by the Atto dye only. Bar, 10 μm. (b,c) We obtained the distributions of Atto fluorescence intensity of Sb2 immunolabelled vesicles containing only endogenous Sb2 (w/o YSpH) and those that additionally contain exogenous Sb2 in form of YSpH (w YSpH). (b) Measurements were performed on vesicles within astrocytes expressing YSpH; some vesicles contained both endogenous Sb2 and YSpH (b, left) (n = 958), while others were devoid of YSpH, expressing only endogenous Sb2 (b, right) (n = 262). (d) The normalized cumulative counts of the Atto intensity in b show significantly different distributions (D = 0.134, P<0.001, Kolmogorov–Smirnov test). The vertical dotted lines drawn indicate the median value of 18,772 a.u. (with YSpH) and 14,115 a.u. (without YSpH) for Atto signals; horizontal dotted line indicates 50% of the total vesicle population. The difference between these two median values (4,657 a.u.) likely denotes the quantum fluorescence of exogenous Sb2, that is, YSpH, which was ~1/3 of that found in vesicles containing only endogenous Sb2. (c) Similar distribution as in b, only that we measured Atto fluorescence intensities of Sb2 immunolabelled vesicles in YSpH-expressing (c, left) (n = 499) and in non-transfected astrocytes (c, right) (n = 419), respectively. (e) The normalized cumulative counts of the Atto intensity in c show significantly different distributions (D = 0.184, P<0.001, Kolmogorov–Smirnov test); the median values at 16,316 a.u. and 13,382 a.u. for Atto signals of w and w/o YSpH vesicles and the difference between these two median values (2,934 a.u.) suggests that exogenous Sb2 molecules represent ~1/5 of the number of endogenous Sb2 molecules; dotted lines as in d.
