
Figure 4. Spontaneous VF 15 s After Its Onset and Its Termination With Ranolazine in a Heart Exposed to 0.1 mM H2O2.
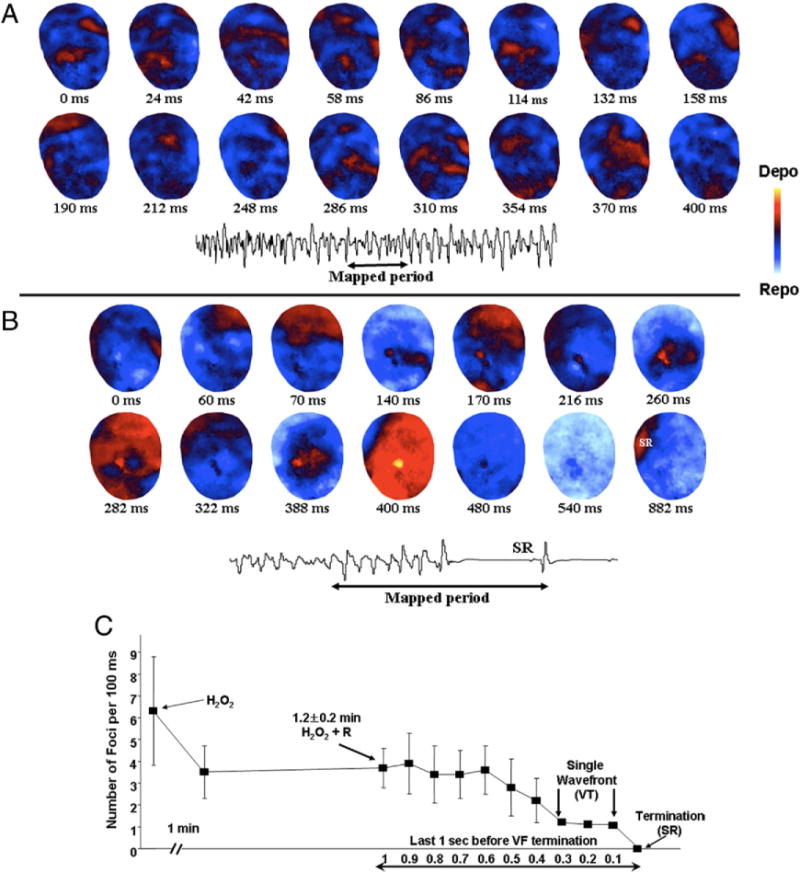
(A) Snapshots of spontaneous VF 15 s after its onset in a heart exposed to 0.1 mM H2O2 and (B) its termination with ranolazine (10 μM) in the continuous presence of H2O2. Multiple epicardial foci (red) during the VF separated by recovered tissue (blue) is evident. This pattern of VF persisted for more than 3 min as confirmed by periodic optical mapping of the VF. However, 1 min after ranolazine perfusion (B), the number of multiple foci progressively decreased, hastening the termination of VF and resumption of SR. (C) Time course of the reduction in the number of foci after ranolazine perfusion. Abbreviations as in Figures 1 and 2.