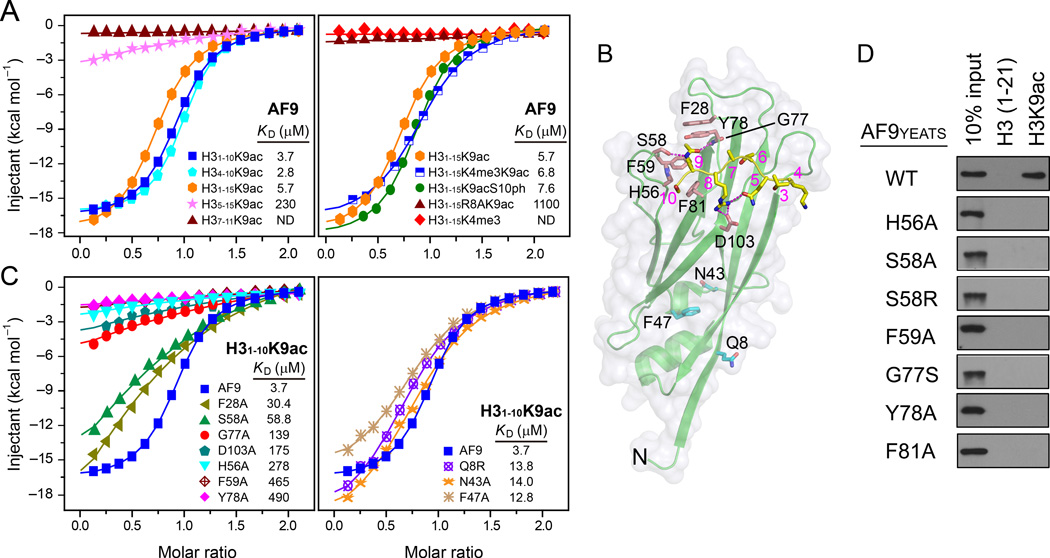
Figure 4. Analysis of the AF9 YEATS-H3K9ac interactions.
(A) ITC fitting curves of AF9 YEATS titrated with different frames of the H3K9ac peptides (left) and the H3 peptides containing different modifications (right).
(B) The AF9 YEATS-H3K9ac complex structure highlighting the residues used for the mutagenesis and binding studies.
(C) ITC fitting curves of H31–10K9ac peptide with point mutants clustered to H3 binding (left) or non-binding (right) surfaces.
(D) Western blot analysis of the peptide pulldown analysis using the WT AF9 YEATS domain and the indicated point mutants.

