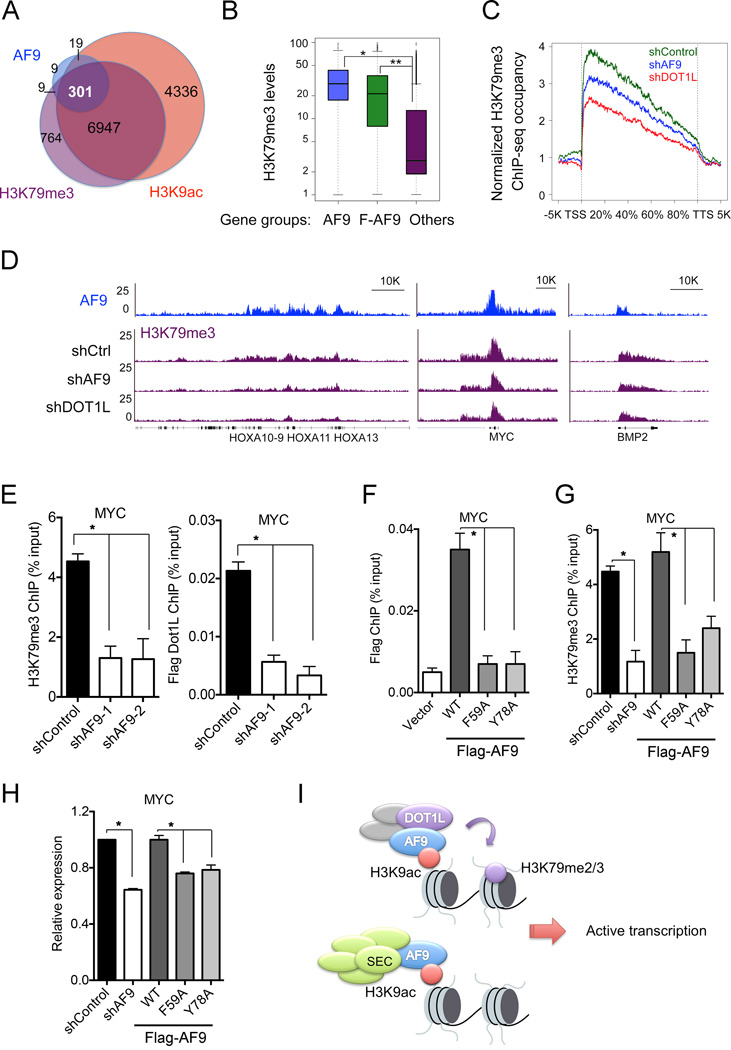
Figure 7. AF9 Is Required for DOT1L-Dependent H3K79me3 Deposition and Gene Activation.
(A) Venn diagram showing the overlap of AF9-, H3K9ac- and H3K79me3-occupied genes. P< 3.0e-82 (3-way Fisher's exact test).
(B) AF9-occupied genes have higher H3K79me3 levels. Box blots showing the average H3K79me3 levels in the AF9- (blue) or Flag-AF9- (green) occupied genes and the other genes (purple). *: P<2.4e-64, **: P<1.2e-163.
(C–E) AF9 depletion reduces the H3K79me3 levels on AF9-occupied genes.
(C) Average H3K79me3 occupancy along the transcription unit of the AF9-occupied genes in control (shControl, green) and AF9 KD (shAF9, blue) HeLa cells. H3K79me3 occupancy on the AF9-occupied genes in DOT1L KD cells (shDOT1L, red) is shown for comparison. The gene body length is aligned by percentage from the TSS to TTS. 5 kb upstream of TSS and 5kb downstream of TTS are also included.
(D) Genome-browser view of the H3K79me3-ChIP-seq peaks on the indicated genes or regions in cells as in (C). AF9 ChIP-seq peaks are shown on top.
(E) qPCR analysis of H3K79me3 and Flag-DOT1L ChIP on MYC in control and AF9 KD HeLa cells stably expressing Flag-DOT1L.
(F) qPCR analysis of Flag-AF9 ChIP in cells stably expressing WT or mutant Flag-AF9.
(G) AF9 YEATS–H3K9ac interaction is required for H3K79me3 deposition on MYC. qPCR analysis of H3K79me3 ChIP in control and AF9 knockdown cells expressing WT or the indicated mutant Flag-AF9.
(H) qPCR analysis of MYC expression in cells as in (G).
In panels E-H, the error bars represent the S.E.M. of three experiments. *: P<0.05 (two-way unpaired Student’s t-test).
(I) Working model of the recruitment of DOT1L and the SEC complex by AF9 via recognition of H3K9ac by the YEATS domain.
See also Figure S6.

