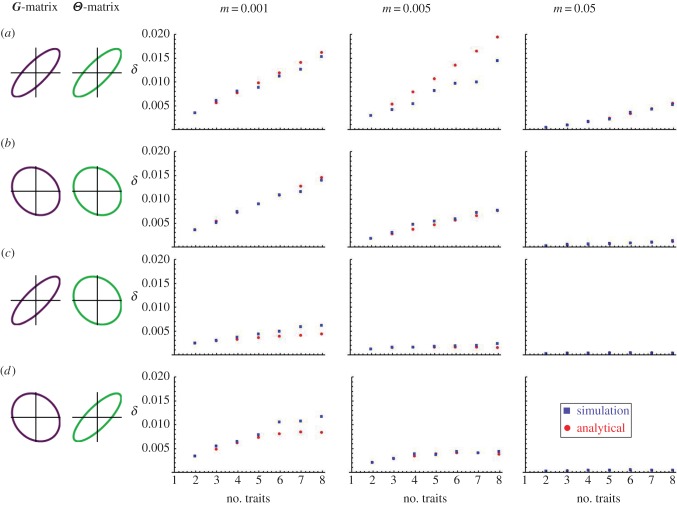
Figure 3.
The effect of dimensionality on the extent of local adaptation produced in individual-based simulations (red squares) compared with the predicted analytical values (blue circles). Simulations were run with 200 populations, each containing 200 individuals for a time span of 1500 generations. The strength of selection for the simulations varied stochastically about γ = 0.01, while the analytical predictions were found given γ = 0.01. Traits and optima were drawn from multivariate normal distributions with unit variances and the following correlations: (a) (ρG = 0.9, ρΘ = 0.9), (b) (ρG = −0.1, ρΘ = −0.1), (c) (ρG = −0.9, ρΘ = −0.1) and (d) (ρG = −0.1, ρΘ = −0.9). (Online version in colour.)

