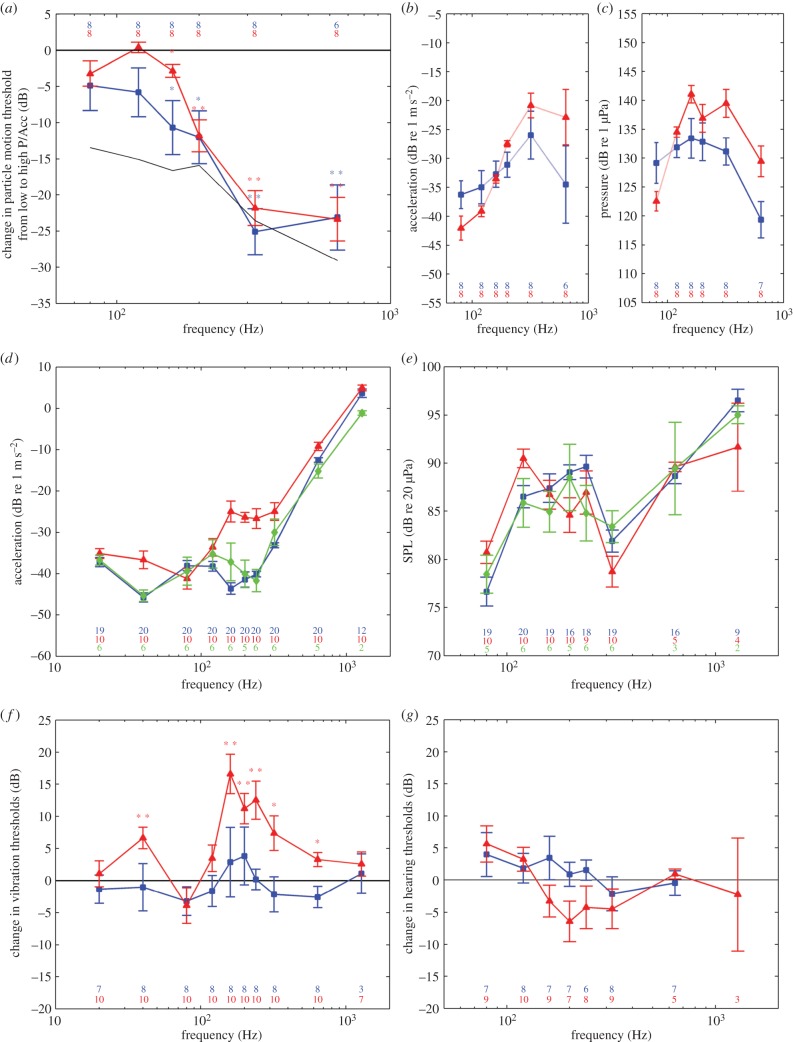
Figure 3.
Hearing and vibration sensitivity of juvenile and adult axolotls, and adult tiger salamanders in (a–c) water and (d–g) air. (a) Relative change in particle motion thresholds from high-particle-motion to high-pressure depth for juvenile (blue squares) and adult axolotls (red triangles) along with the change in particle motion-to-pressure ratio (black line). Asterisks indicate statistical significance (paired t-test, *p < 0.05; **p < 0.01). (b) Average particle motion audiograms of juvenile (blue squares) and adult axolotls (red triangles) from the high-particle-motion depth. (c) Average pressure audiogram of juvenile (blue squares) and adult axolotls (red triangles) from the high-pressure depth. (d) Vibration sensitivity of juvenile axolotls (blue squares), adult axolotls (red triangles) and tiger salamanders (green diamonds) in response to vertical shaker vibrations. (e) Sound pressure sensitivity of juvenile axolotls (blue squares), adult axolotls (red triangles) and tiger salamanders (green diamonds). (f) Average change in vibration thresholds of axolotls across the metamorphosis (red triangles) along with juvenile controls (blue squares). Asterisks indicate statistical significance (paired t-test, *p < 0.05; **p < 0.01). (g) Average change in sound pressure thresholds of axolotls across the metamorphosis (red triangles) along with juvenile controls (blue squares). Asterisks indicate statistical significance (paired t-test, *p < 0.05; **p < 0.01). Bars are in all plots ±s.e.m. n-values are indicated in each plot.

