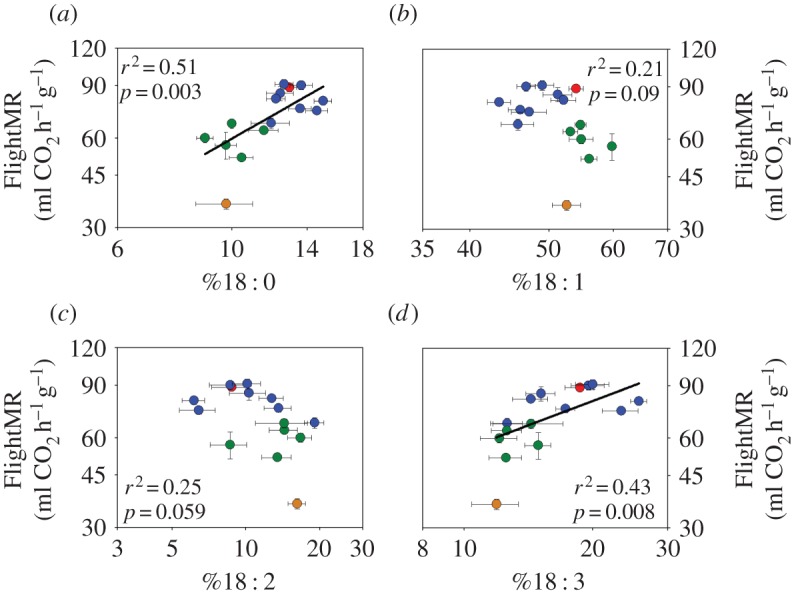
Figure 4.

Relationship between flight metabolic rate (FlightMR) and the relative abundance of fatty acids in the thorax membrane phospholipids of 15 orchid bee species. Metabolic rate as a function of relative abundance is presented for (a) 18 : 0, (b) 18 : 1, (c) 18 : 2 and (d) 18 : 3. Values are means (±s.e.), and colours represent the four genera sampled (blue, Euglossa; red, Eufriesea; green, Eulaema; orange, Exaerete).
