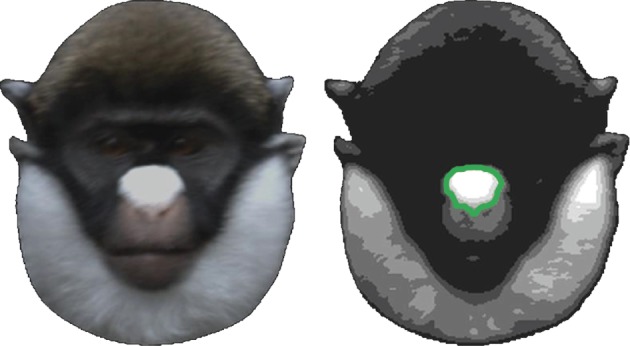
Figure 2.

The image segmentation process. On the left is an example of a C. petaurista male image in LMS colour space that has been cropped and standardized for size, position and orientation. On the right is the PCNN neuron firing time map with the selected region outlined in green. The region selected is the largest nose-spot segment that contains only one subregion. (Online version in colour.)
