Figure 2.

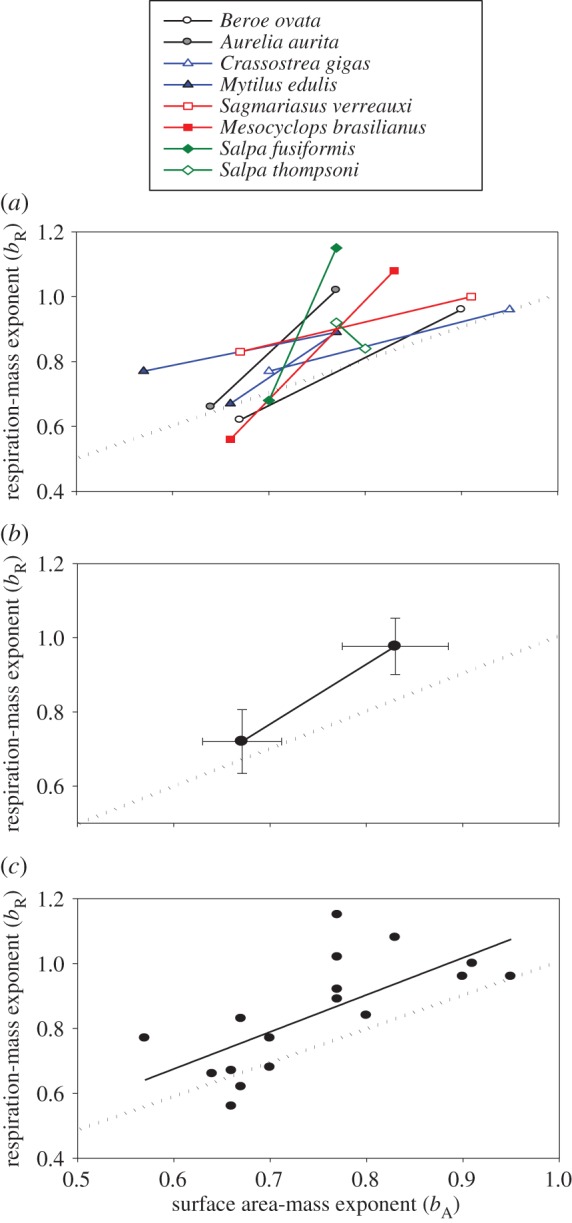
Ontogenetic shifts of respiration–mass exponents (bR) in relation to SA–mass exponents (bA) of several species of aquatic invertebrates (a) and for all species averaged together (b), where bR is the scaling exponent for log10 RMR in relation to log10 body mass, and bA is the scaling exponent for log10 surface area in relation to log10 total body length (data from table 1). Values of bA were calculated using bL values and additional data in the electronic supplementary material. Multiple bR values for the life-history stage of a species were averaged, whereas the midpoint was used when only a range of bA values was available. In (b), the lower left and upper right points were calculated by averaging all of the paired bR and bA values that occurred in ontogenetic stages with the lower versus higher bR, respectively. The 95% confidence limits are shown for each mean value of bR and bA. As predicted by SA scaling theory (also see [8]), in seven of eight species sampled, ontogenetic shifts in bA are accompanied by positively correlated shifts in bR. Also shown in (c) is a significant positive correlation between bR and bA for each ontogenetic stage of each species. The equation for the LSR line is: bR = 1.14 ± 0.64 (95% CI) (bA) − 0.0092 (r2 = 0.454; p = 0.0018, n = 17). In (a–c), the dotted diagonal lines represent bR = bA. (Online version in colour.)
