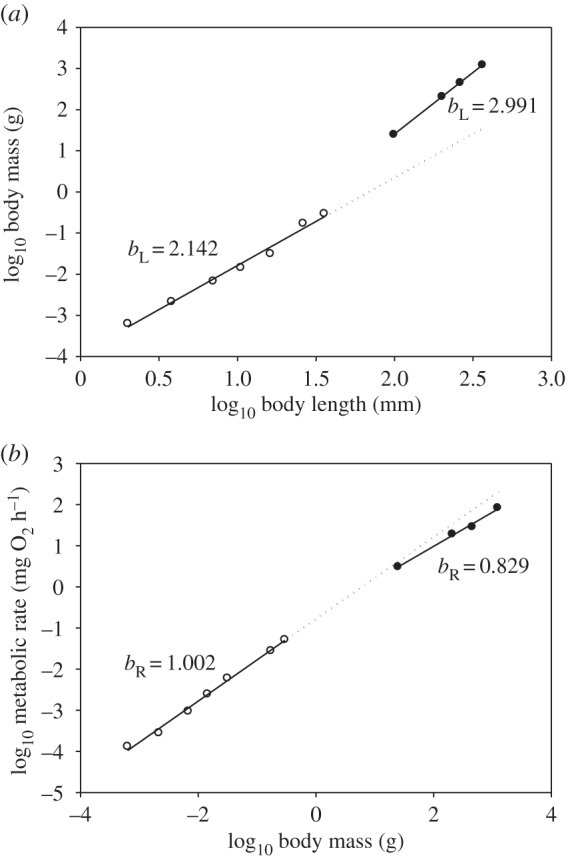
Figure 3.

Scaling of log10 wet body mass in relation to log10 total body length (a) and log10 RMR in relation to log10 wet body mass (b) in phyllosoma larvae (open points) and juveniles (filled points) of the spiny lobster S. verreauxi maintained at 21–23°C. Each point in (a,b) is based on 4–11 replicate measurements, respectively [30,31]. The phyllosoma points represent instars 1, 3, 6, 9, 12, 15 and 17. The standard errors for each RMR value are all less than 20% of the mean. The LSR equations for the scaling lines and their coefficients of determination (r2) and significance levels (p) for phyllosoma larvae and juveniles are: (a) Y = −3.931 + 2.142 (X), r2 = 0.988, p = 0.00001; Y = −4.574 + 2.991 (X), r2 = 1.000, p < 0.00001; and (b) Y = −0.773 + 1.002 (X), r2 = 0.995, p < 0.00001; Y = −0.673 + 0.829 (X), r2 = 0.993, p = 0.00353, respectively. The number by each line is the scaling slope (exponent). Linear extrapolations of the empirical scaling lines for the phyllosoma larvae are shown as dotted lines to highlight the ontogenetic scaling shifts for both body shape (a) and metabolic rate (b).
