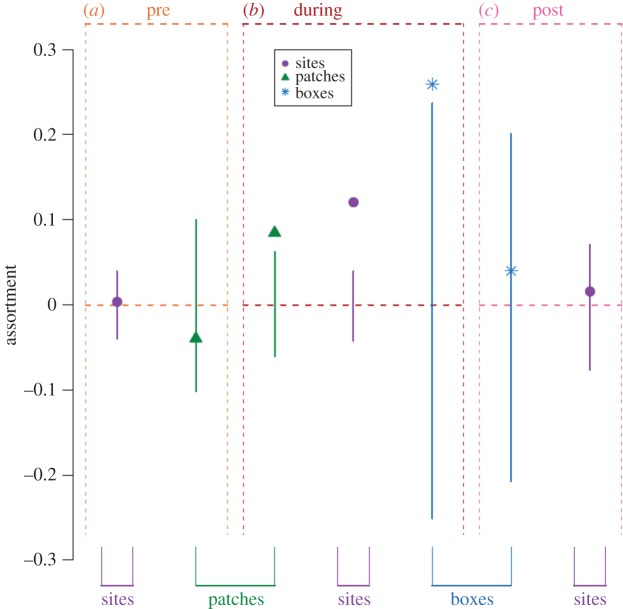
Figure 2.
The observed level of assortment by PIT tag type in the system over the different periods and social contexts. Vertical lines show the 95% range of the assortment coefficients calculated from permuted data. Dots indicate the observed assortment coefficient. Colours of lines and point types illustrate data from different contexts (purple circle, selective feeder sites; green triangle, ephemeral patches; blue star, nest-boxes; base × axis). (a) ‘Pre-manipulation’ period. (b) ‘During-manipulation’ period. (c) ‘Post-manipulation’ period.

