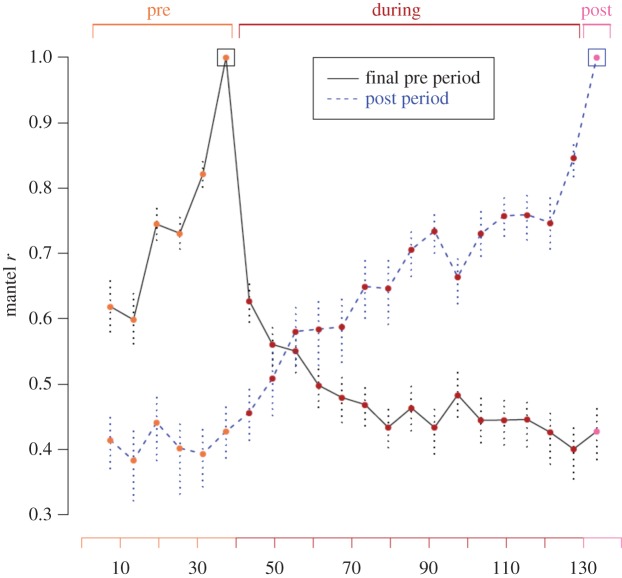
Figure 3.
Mantel test results comparing each 6-day network to the final 6-day network of the pre-experimental period (solid black line) and to the 6-day post-experimental network (dashed blue line). Point colour denotes experimental period. Boxes show point of comparison. Vertical dotted lines indicate 95% range of Mantel test statistic.

