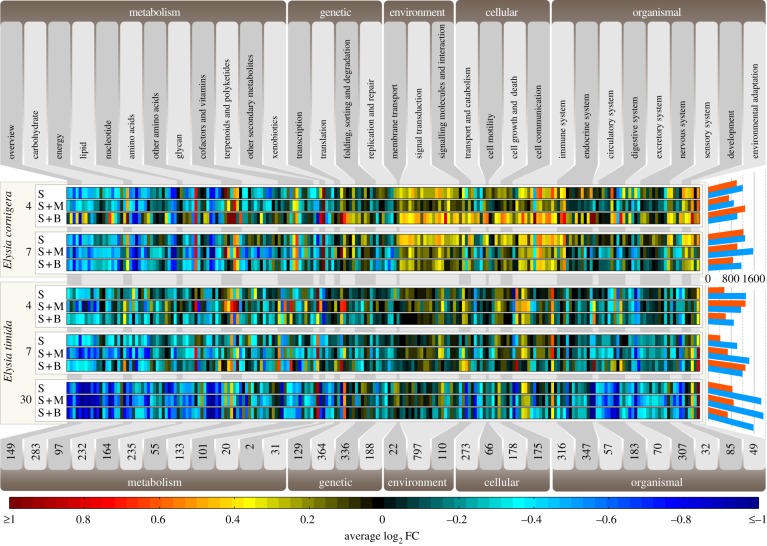
Figure 3.
Gene expression changes of animal KEGG pathways. Transcriptomes were sequenced for both animals after 4 and 7 days of starvation (bold numbers), and additionally after 30 days for E. timida. Elysia cornigera and E. timida were subjected to three different conditions: starvation alone (S), starvation plus monolinuron (S + M; 2 µg ml−1) and starvation plus bleaching (S + B; 1000 µmol quanta m−2 s−1 for 1 h each day). Upregulation is shown from red to black and downregulation from black to blue. The numbers at the bottom represents the amount of K-numbers (KEGG orthology group identifier) found within each reaction module (modules in alternating light and grey flags). The bars on the right show the total number of regulated genes (minimum of twofold) for the individual conditions analysed (blue bars, downregulation; red bars, upregulation).

