
Figure 3.
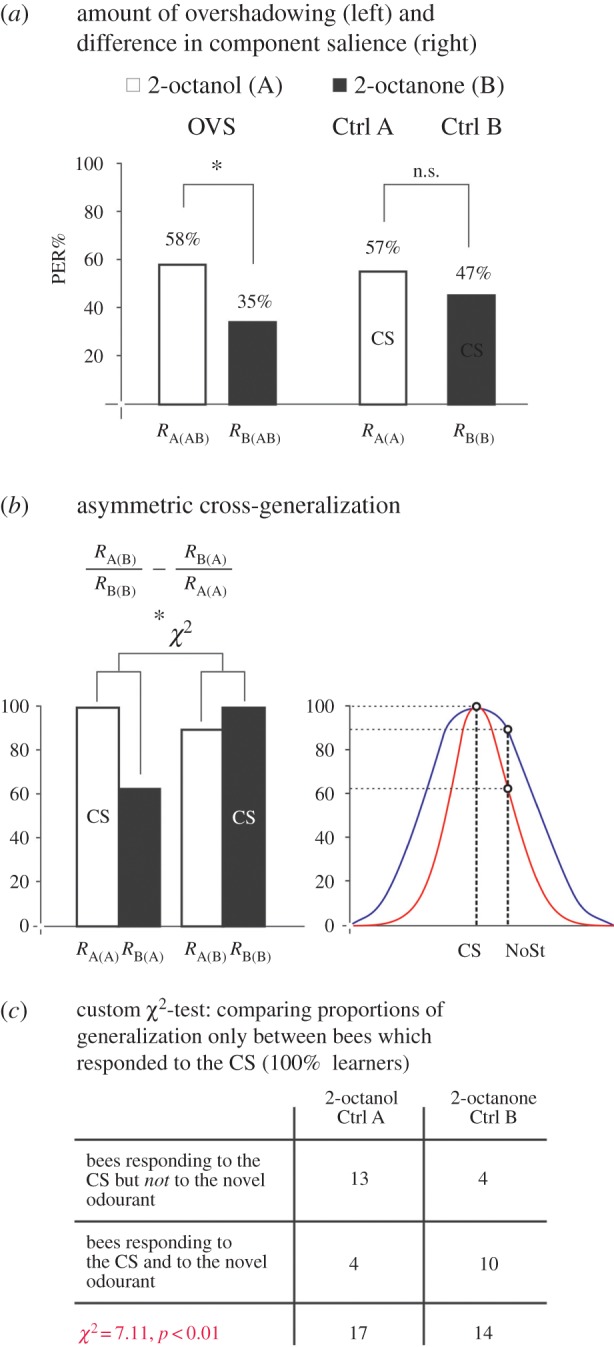
Quantitative analysis of the overshadowing effect (a) and of asymmetric cross-generalization (b,c) after a 1-trial conditioning. (a) The overshadowing effect. Test responses to the single odourants (A: 2-octanol, B: 2-octanone) after mixture conditioning in the OVS group (RA(AB) and RB(AB)) and test responses to the component after component conditioning in Ctrl A (RA(A)) and Ctrl B (RB(B)). The results show that the significant overshadowing effect (OVS group) is not correlated with a significant difference between the learning levels of the two odourants. n.s., non-significant; *p < 0.05. (b) The asymmetric cross-generalization effect. The asymmetric cross-generalization was calculated as RA(B)/RB(B) − RB(A)/RA(A). Only bees responding to the CS (A in Ctrl A and B in Ctrl B) were used for this analysis; thus, their response levels are set to 100% (left panel, CS bars). The asymmetric cross-generalization found could be explained by differences in the generalization profiles of the two odourants (right panel). The element with a narrow generalization profile (red line) show less generalization to a novel stimulus (NoSt) than the element with a broader generalization profile (blue line). (c) The 2 × 2 table used for statistical analysis (χ2) of the asymmetric cross-generalization. The table presents in the first row the number of bees responding to the CS but not to the novel odourant and in the second row the number of bees responding to both the CS and the novel odourant in the Ctrl A and Ctrl B groups.