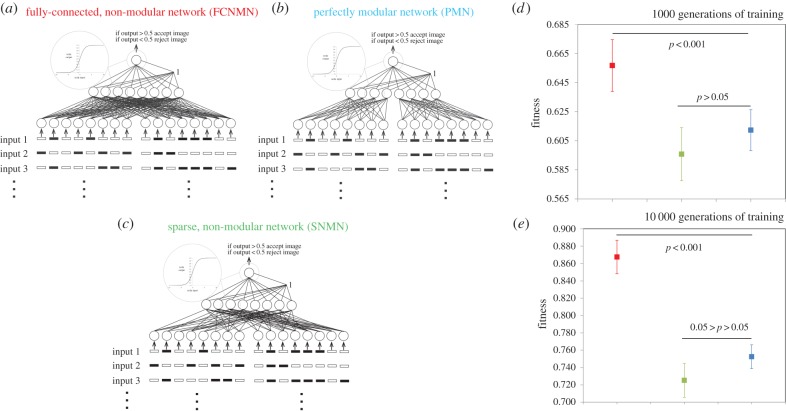
Figure 1.
Performance of ‘small’ (b) modular (PMN) and (a,c) non-modular (FCNMN and SNMN) neural networks with the same number of nodes training to identify subsets of random inputs. Mean networks fitness (n = 20) with 95% CIs is analysed at generation 1000 and 10 000 of training. Statistics: (d) generation 1000; FCNMN (red) versus PMN (blue), t38 = 4.09; SNMN (green) versus PMN (blue), t38 = −1.50; (e) generation 10 000; FCNMN versus PMN, t38 = 10.8; SNMN versus PMN, t38 = −2.39. Note that the vertical axes of plots are not standardized and show different ranges. (Online version in colour.)

