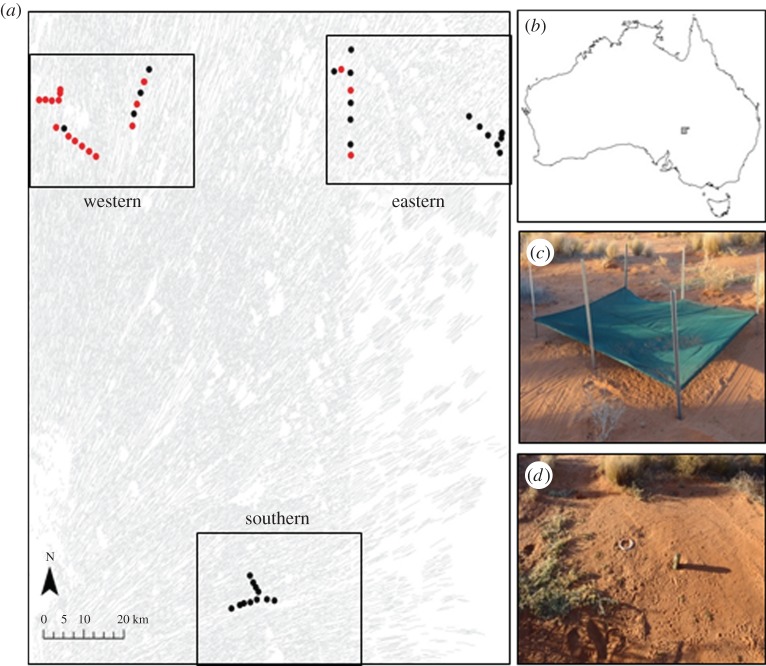
Figure 1.
(a) Map showing the study area in the Strzelecki Desert of central Australia. Black circles represent sites used in experiment 1; red circles represent sites used in both experiments 1 and 2. Rectangular polygons represent the eastern, western and southern regions of the study area. Underlying grey lines represent longitudinal sand dunes. (b) Location of the study area (grey polygon) within Australia. (c) A photograph of the covered, ‘safe′ treatment areas used in experiment 2. (d) A photograph of the open, ‘risky′ treatment areas used in experiment 2.

