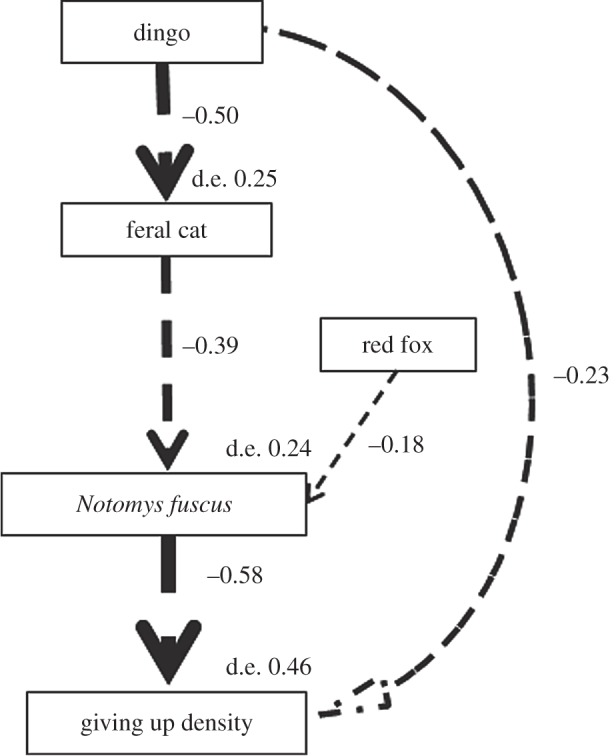
Figure 4.

The most parsimonious SEM explaining the giving up density of N. fuscus in experiment 1. Dashed arrows represent negative pathways and are weighted by standardized path coefficient estimates. The SEM suggests that cat activity was higher where dingo activity was low; that N. fuscus abundance was higher where cat and fox activity were low and dingo activity was high; and that the giving up density of N. fuscus increased with increasing dingo activity and N. fuscus abundance. d.e., deviance explained by each variable.
