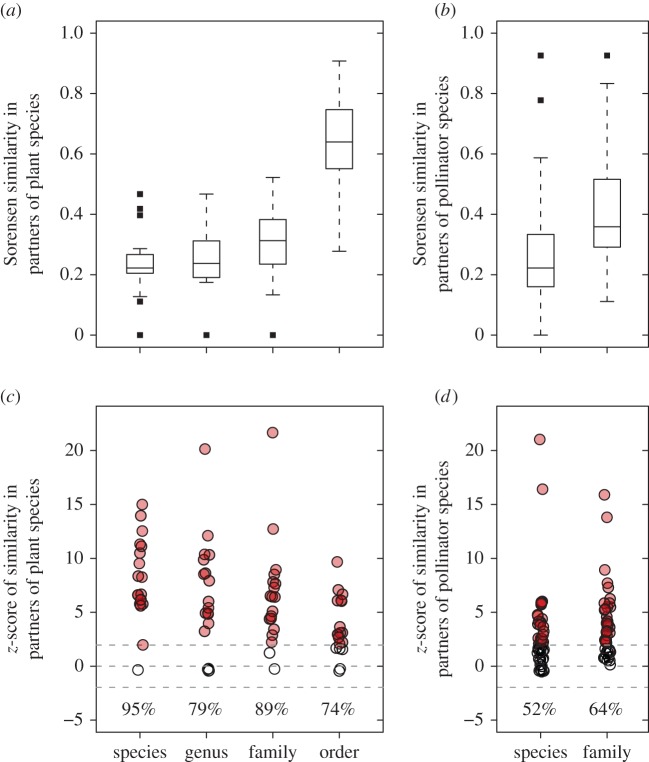
Figure 4.
Averaged partner similarities of (a) plant and (b) pollinator species observed in more than two networks across the Canarian archipelago, and with the partners resolved to species, genus, family and order. Boxes represent the interquartile range (IQR), horizontal lines within the boxes represent medians, whiskers extend to 1.5 times the IQR, and outliers are plotted as squares. (c,d) The z-score measures the deviation from random and most plant species (c) and approximately half of the pollinators (d) showed significant partner fidelity (i.e. z-score ≥ 1.96). In (c,d), filled circles represent species with z-scores ≥ 1.96 and the percentage denotes the proportion of plant (n = 19) and pollinator species (n = 48) that differed significantly from random. Points in (c,d) have been jittered slightly to increase visual clarity and superimposed points results in darker colours. (Online version in colour.)

