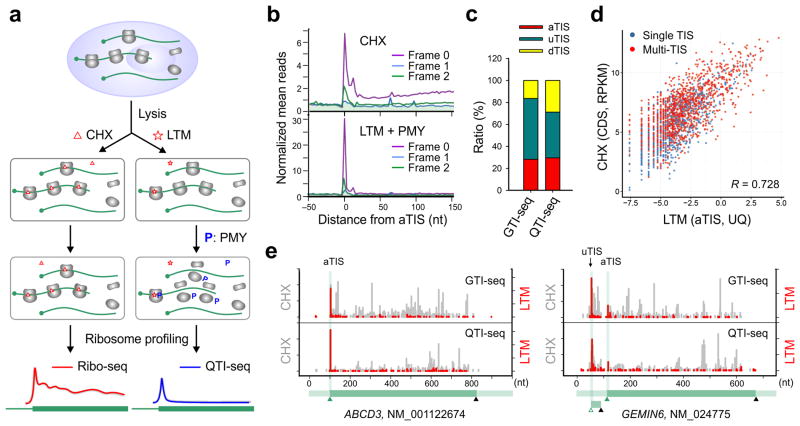
Figure 1. QTI-seq captures real-time translation initiation events in a qualitative and quantitative manner.
(a) Schematic of Ribo-seq (left panel) and QTI-seq (right panel) procedures. The red line represents the ribosome density on average based on regular Ribo-seq, whereas the blue line indicates the density of initiating ribosome obtained from QTI-seq.
(b) Meta-gene analysis of CHX-associated ribosome density (top panel) and LTM-associated ribosome density (bottom panel) in HEK293 cells captured by QTI-seq. Normalized RPF reads are averaged across the entire transcriptome and aligned at the annotated start codon. Different reading frames are separated and color coded.
(c) A stacked bar plot showing the relative ratio of different types of TIS identified by GTI-seq or QTI-seq in HEK293 cells.
(d) A scatter plot showing the correlation between LTM-associated aTIS density normalized by upper quartile and CHX-associated CDS ribosome occupancy normalized by RPKM. Genes with single annotated TIS or multiple TISs are shown in blue and red dots respectively.
(e) Examples of single TIS (ABCD3) and multiple TIS (GEMIN6) genes revealed by GTI-seq (top panel) and QTI-seq (bottom panel). The same scale is used for Y-axis. The corresponding gene structure is shown below the X-axis.

