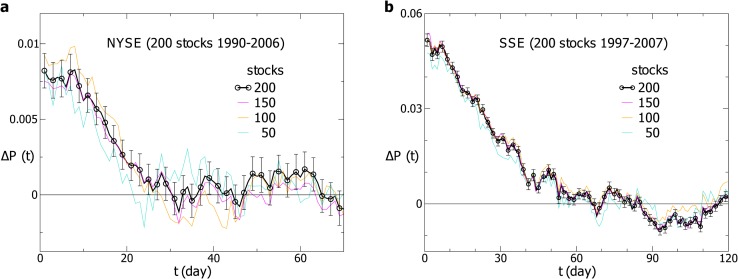
Fig 1. The probability difference for the individual stocks.
The probability difference ΔP(t) for (a) 200 individual stocks in the SSE and (b) 200 individual stocks in the NYSE. The black line shows ΔP(t) averaged over 200 stocks with error bars. The other lines represent ΔP(t) averaged over 150, 100, and 50 randomly chosen stocks. The time windows are T 1 = 24 and T 2 = 205 for the NYSE, and T 1 = 10 and T 2 = 210 for the SSE.

