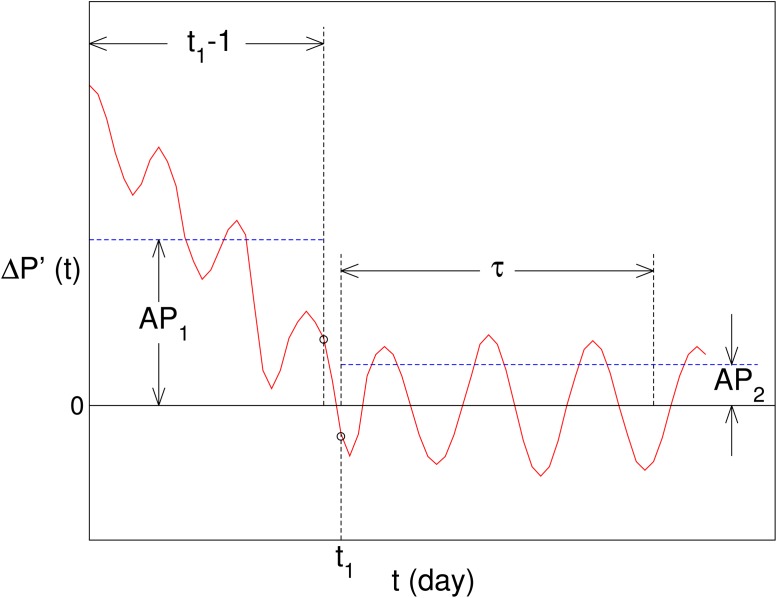
Fig 3. A schematic graph of the criteria for identifying non-zero ΔP.
The red line represents ΔP′(t), which is the 3-point smoothed ΔP(t). t 1 is the day when the sign of ΔP′(t) changes for the first time. We define ΔP′(t) in the range of 1 ≤ t ≤ t 1 − 1 as the first part, and that in the range of t 1 ≤ t ≤ t 1 + τ − 1 as the second part. The average absolute values for the first and second parts are denoted by AP 1 and AP 2, respectively.

