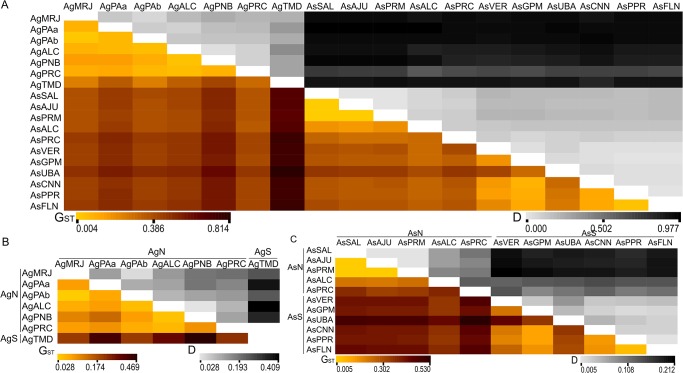
Fig 2. Pairwise comparisons of population genetic differentiation in A. germinans and A. schaueriana.
Pairwise measurements of the genetic variation between samples in terms of Nei’s GST (1973—below diagonal) and D (Jost 2008—above diagonal) values in A) both A. germinans and A. schaueriana, B) A. germinans, and C) A. schaueriana samples. AgN and AgS and AsN and AsS refer to samples of A. germinans and A. schaueriana taken from locales north and south of the NEESA, respectively. All measures were significant (p < 0.05).

