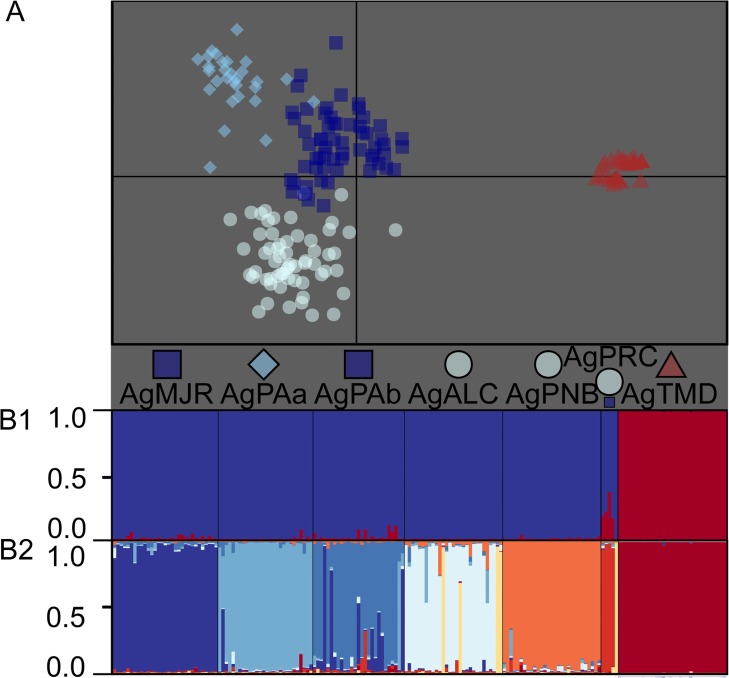
Fig 4. A. germinans population structure along the Brazilian coast.
A) A scatterplot of the first two principal components of the multivariate analysis of DAPC [36], which resulted in a most likely k value of 4. Symbols indicate the group to which each individual was assigned. The geographic origin of each individual is denoted for each locality sample such that more than 10% of the total number of individuals was composed of the inferred cluster. A larger symbol indicates that a cluster was predominant in the locality sample (pairwise cluster ratio larger than 1:5), whereas equal symbol sizes indicate similar cluster contributions to the total number of individuals in each sample. B1) Model-based clustering analyses [38,39] considering k = 2 and B2) k = 8, where each individual is represented by a vertical line and each color refers to one inferred cluster; the posterior probability of group membership is indicated.

