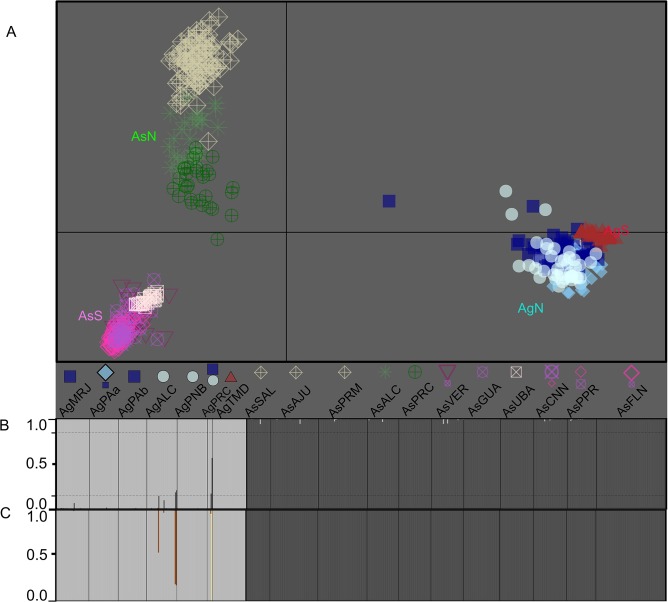
Fig 7. Analyses of ongoing hybridization between A. germinans and A. schaueriana.
A) A scatterplot of the first two principal components of the multivariate analysis of DAPC [36]. Each symbol indicates the group to which each individual was assigned. The geographic origin of each individual is denoted for each locality sample such that more than 10% of the total number of individuals is composed of the inferred cluster. A larger symbol indicates that a cluster was predominant in the locality sample (pairwise cluster ratio larger than 1:5), whereas equal symbol sizes indicate similar cluster contributions to the total individuals of each sample. B) Model-based clustering analyses [38,39] considering k = 2, where each individual is represented by a vertical line and each color refers to one cluster; the posterior probability of group membership is indicated. The dashed horizontal lines denote the arbitrary threshold of 0.15, which was used as a sign of possible interspecific hybridization. C) Posterior probability of the model-based approach for identifying species hybrids [45]. Each vertical line also refers to an individual, and different colors indicate distinct classes of individuals: light gray: “pure” A. germinans; dark gray: “pure” A. schaueriana; dark orange: A. germinans second-generation backcrossed individuals; and yellow: F1 interspecific hybrid.

