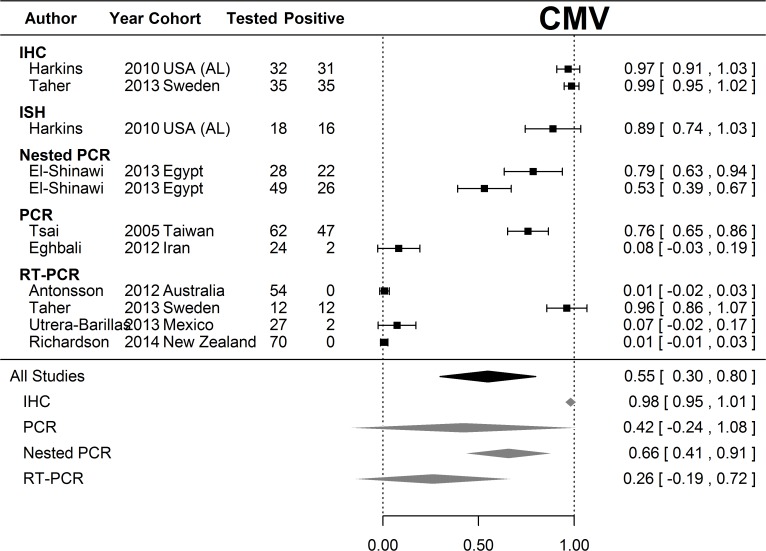
Fig 2. Meta-analysis of CMV positivity in breast cancer tissue samples.
Random effects meta-analysis was performed on the proportions of samples that were positive for CMV. Proportions had 95% confidence intervals derived from the Normal approximation to the binomial with 0.5 added to zero counts. Estimates of the average proportion positive were calculated for all studies and for each assay type that was used in multiple studies. Results of studies that analyzed breast tissue samples for CMV are shown according to the method of analysis. The overall strength of association for each type of analysis, and the overall strength of association for all studies are shown at the bottom of the figure. There was considerable heterogeneity in the CMV analyses (I2 = 99.6%). Footnote to Fig. 2: PCR results for Harkins et al were not included in this meta-analysis because nested PCR was performed on only 8 specimens, all of which were positive on IHC (please see S1 Table).

