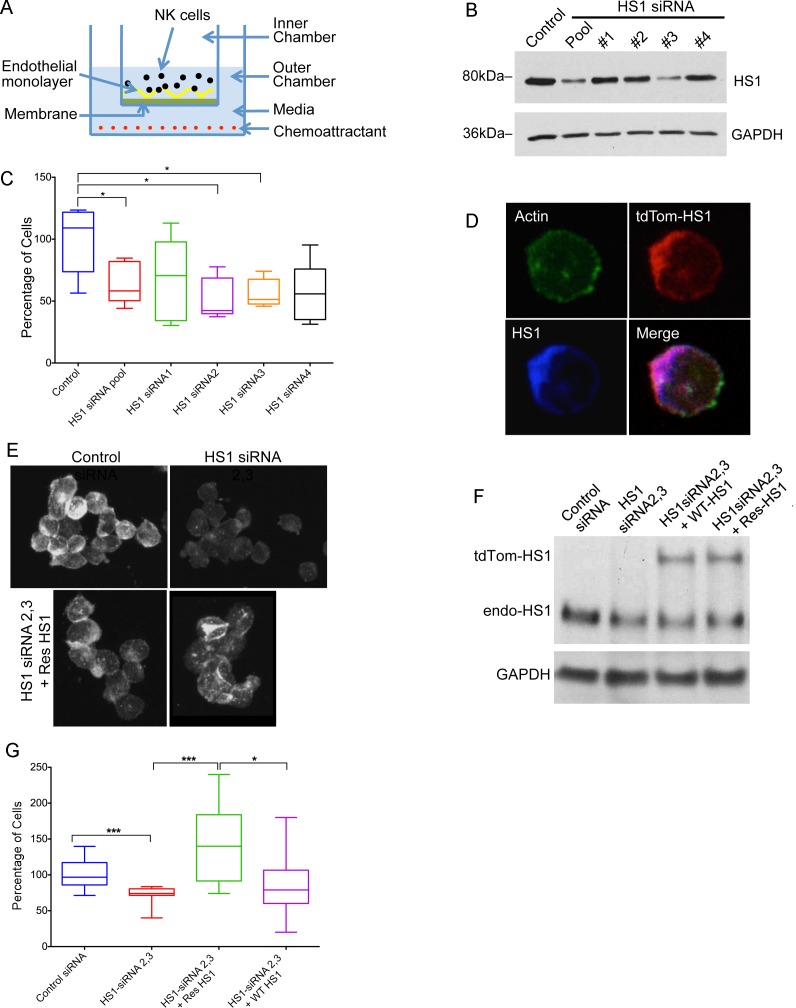
Fig 1. HS1 and TEM of NK cells in transwell assays.
A) Diagram of transendothelial migration assay in a transwell device. B) Depletion of HS1 protein by siRNA, shown by immunoblot after 72 hrs. NK cells were treated with a pool of four siRNAs or one of the four. GAPDH is a loading control. C) Effects of HS1 knockdown on TEM. Plotted values are number of cells in the lower chamber, as a percentage of the mean of the control sample value on each day. Box-and-whisker plots (box: 25th to 75th percentiles, whiskers: min to max, middle line: median). Asterisks indicate statistical significance (*P<0.05. Unpaired Student’s t-test, n = 5 for each condition.) D) Fluorescence micrographs of NK cells, showing expression and co-localization of expressed HS1-tdTomato (red), F-actin (green, Alexa Fluor 488 phalloidin), and total HS1, including endogenous (blue, anti-HS1 staining). E) Fluorescence micrographs of NK cells stained with anti-HS1 to show siRNA-induced depletion of HS1 and expression of siRNA-resistant HS1 protein. F) Expression of siRNA-resistant HS1 in NK cells knocked down for HS1 with siRNA, shown by immunoblot with anti-HS1. Knockdown used a combination of HS1 siRNAs 2 and 3. G) Rescue of TEM phenotype in HS1-knockdown NK cells by expression of HS1. Cells as in panels E and F. Number of cells in the lower chamber, as a percentage of the mean of the control sample value on each day, with box-and-whisker plots as in panel C. Asterisks indicate statistical significance. (* P< 0.05, *** P < 0.0005. Unpaired Student’s t-test, N = 9–12 experiments for each condition.)

