
Fig 2. TEM events by NK cells on HDMVEC monolayers based on live-cell movie analysis.
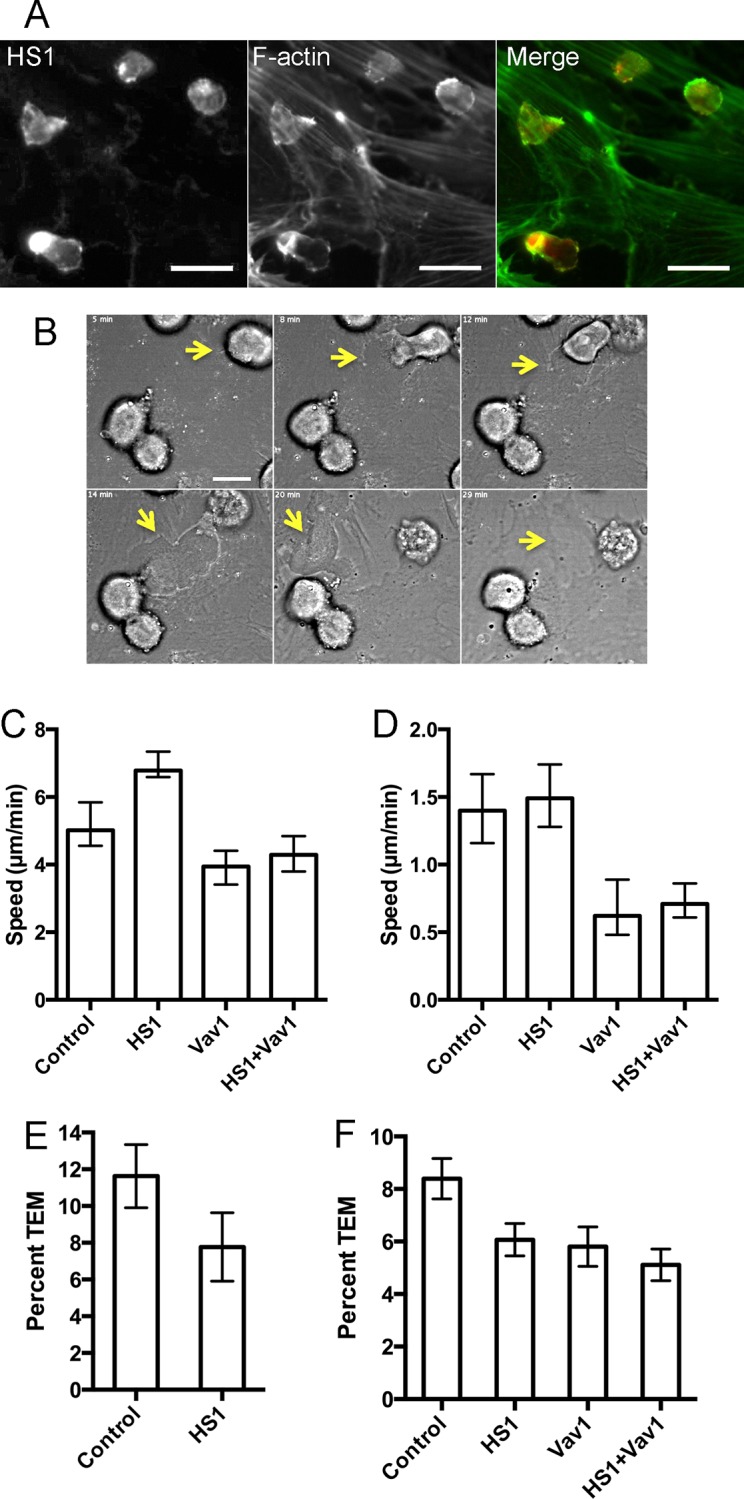
A) Endogenous HS1 (red) and F-actin (green) in NK cells migrating on the surface of HDMVEC monolayer observed by anti-HS1 and phalloidin fluorescence. Scale bar = 20 μm. B) DIC images from a movie (S2 Movie), illustrating how the passage of the NK cell through the endothelial monolayer leaves a defect. Scale bar = 10 μm. C) Speed of cell migration, based on path length. Median and 95% confidence intervals are plotted. Data from Table 4-1. D) Speed of cell migration, based on net displacement. Median and 95% confidence intervals are plotted. Data from Table 4-2. E) Percentage of TEM events from movie analysis with SDF-1α. The number of TEM events as a percentage of the total number of NK cells on the surface of the endothelial monolayer in the first frame. Error bars are standard error of proportion. The difference is not statistically significant by z-test (p = 0.15) or by Fisher’s exact test for a 2 x 2 contingency table (p = 0.19). Data combined from two or three experiments per day on three days. F) Percentage of TEM events from movie analysis without SDF-1α. The number of TEM events as a percentage of the total number of NK cells on the surface of the endothelial monolayer in the first frame. Error bars are standard error of proportion. The differences between control and depleted-cell values are statistically significant with p values of 0.022, 0.024 and 0.001 for HS-depleted, Vav1-depleted and HS1+Vav1-depleted NK cells, based on chi-square tests with Yates’ correction. No other differences are statistically significant. Data combined from experiments on three days.