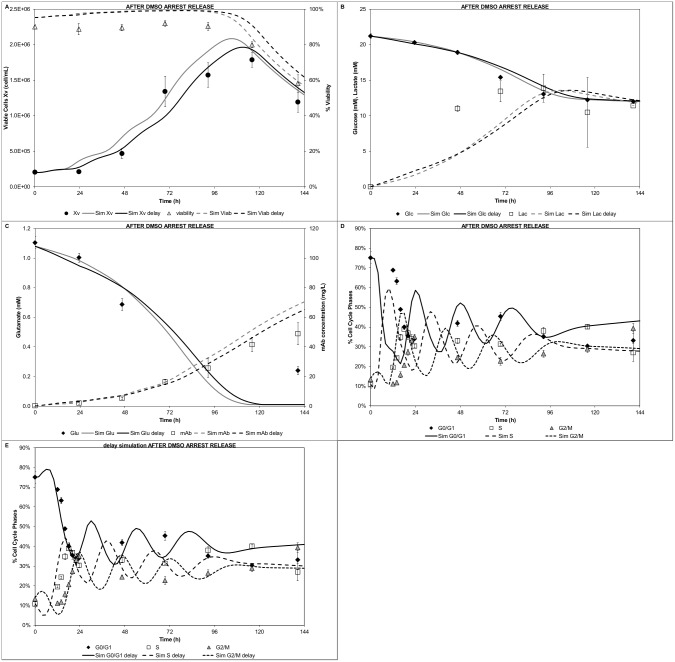
Figure 8. Modelling of after DMSO arrest release experiment.
A) Cell growth and viability, B) Glucose and lactate concentration profiles, C) Glutamate and mAb concentration profiles, D) Cell cycle distribution, E) Cell cycle distribution delay simulation. Grey lines: simulation with estimated parameters; Black lines: simulation with DMSO delay parameters (Table 2)

