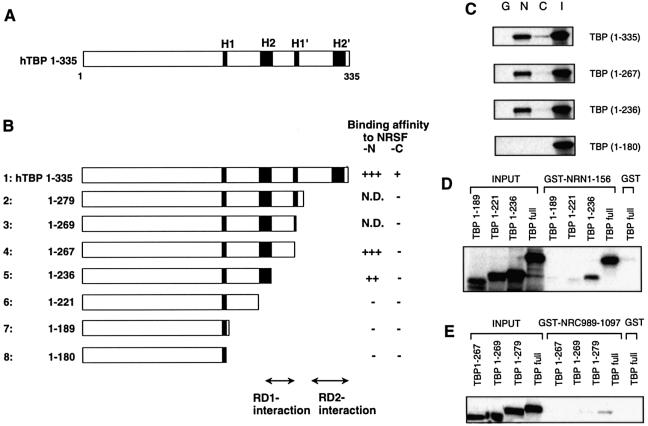
Figure 3.
Delineation of the NRSF RD-1- and RD-2-binding regions on TBP. (A) Schematic representation of the TBP structure. The evolutionarily conserved helix regions (H1, H1′, H2 and H2′) are indicated by shaded boxes. (B) TBP deletion constructs used in the GST pull-down assay. The relative binding affinity of TBP for NRSF-N or NRSF-C was assessed by quantification of the autoradiograms and scored from background level (–) to strong interaction (+++); N.D.; not determined. The RD-1- and RD-2-interaction regions are indicated. (C) Specific binding of NRSF-RD-1, i.e. N1–156 (N), or RD-2, i.e. C989–1097 (C) to the in vitro translated TBP deletion constructs. GST alone (G) was used as a negative control and a 20% aliquot of total input protein (I) was loaded as a control. To identify the binding region in more detail, we used another series of TBP deletion constructs with NRSF-N (D) or NRSF-C (E).

