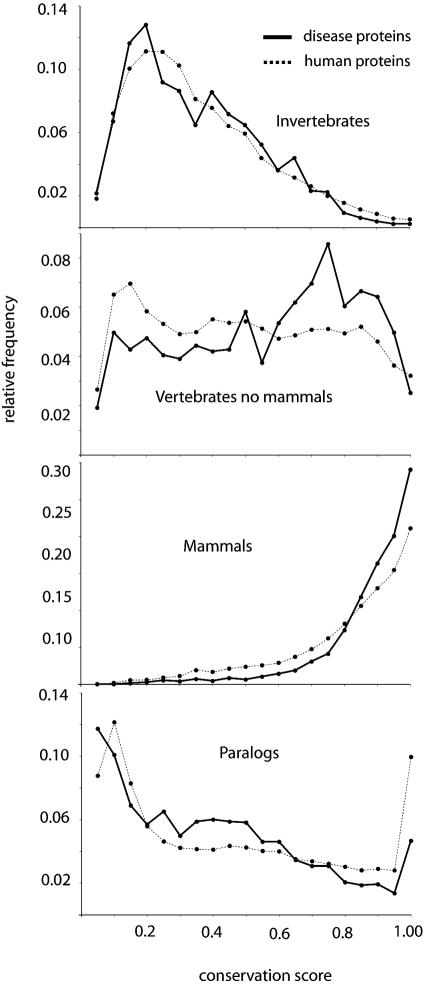
Figure 2.
Conservation and paralogy of disease proteins. Distribution of conservation score of disease (solid line) and all human proteins (dotted line) against their closest homologue in invertebrates, vertebrates (not mammals) and mammals, and between paralogues. The conservation score gives an estimation of the mutation rate that the protein has been subjected to during evolution that is independent of the length of the protein: it is calculated as the BLAST score of the closest homologue in one taxonomic group, or the closest paralogue divided by the BLAST score of the protein against itself, ranging from 0 to 1 (when the closest homologue is 100% identical).

