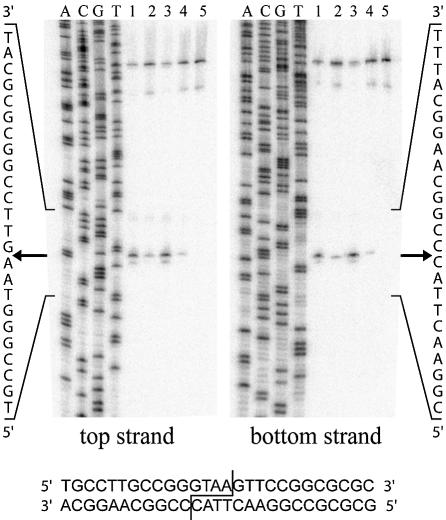
Figure 6.
Cleavage-site mapping of I-DmoICL, I-DmoIH and I-DmoIS. The cleavage positions (arrows) on the top (left) and bottom (right) strand were mapped for I-DmoI (lane 1), I-DmoICL (lane 2), I-DmoIH (lane 3) and I-DmoIS (lane 4). Lane 5, no-protein control. A, C, G and T indicate the base in the sequencing ladder; left and right, the sequence readout for the area of interest as marked; bottom, the I-DmoI homing site with the cleavage position indicated.

