
Figure 1.
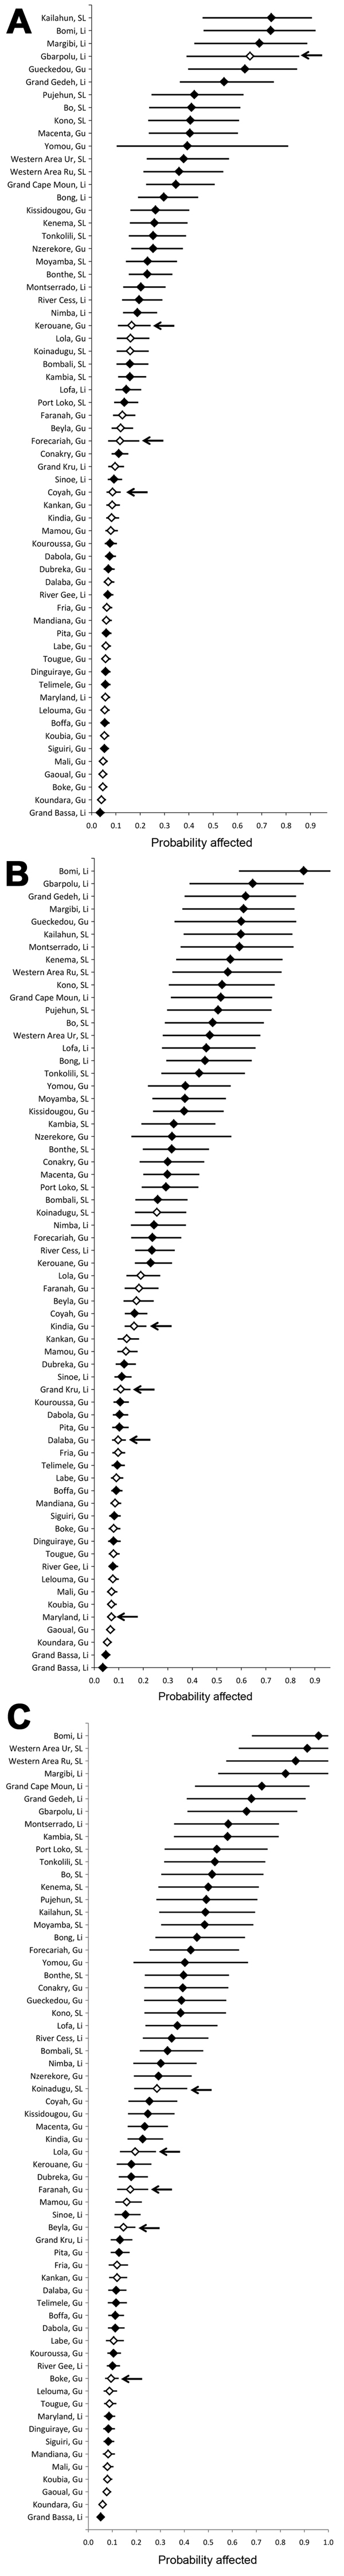
Probability predictions (with 95% CIs) for districts in countries primarily affected by Ebola virus infection in 2014, by week of analysis. A) Data available through week 33 (August 16). B) Data available through week 36 (September 6). C) Data available through week 39 (Sep 27). Diamonds indicate the probability that the districts should be affected at the time of the analysis. Filled diamonds indicate districts that were affected (i.e., had reported at least 1 case) at the date of the analysis. Black arrows identify those districts that became affected within 3 weeks of the date of analysis. SL, Sierra Leone; Gu, Guinea; Li, Liberia.