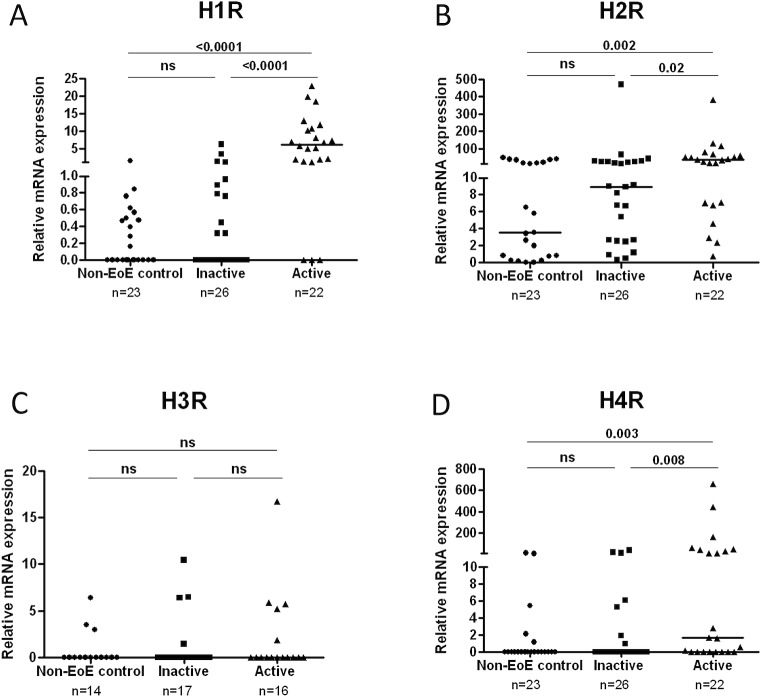
Fig 2. Expression of H1R, H2R, and H4R 4 are increased in esophageal biopsies in actively inflamed EoE.
Comparison of H1,H2, H3, and H4 receptor expression in non-EoE control, inactive EoE and active EoE biopsies, using Mann-Whitney test (A-D). Horizontal bars represent median of each data set. Horizontal lines represent median of the data set.

