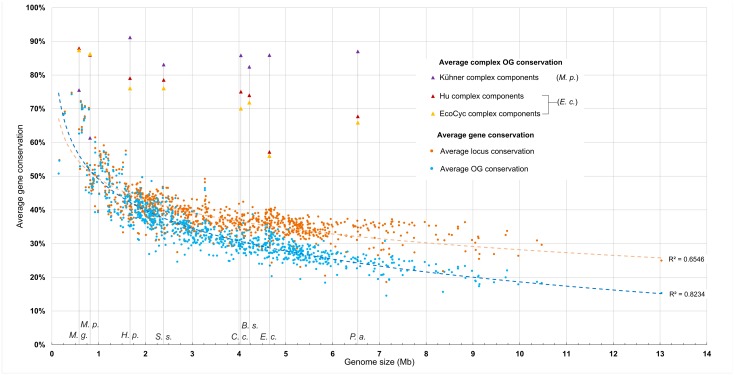
Fig 1. Protein complexes are enriched for highly conserved components.
Each point indicates a single genome and the average conservation of its loci or orthologous groups (OGs) as measured by its presence across 898 bacterial genomes. Representative genomes of the 8 species focused on in this study are indicated with vertical lines and the following labels: M. g., Mycoplasma genitalium; M. p., Mycoplasma pneumoniae; H. p., Helicobacter pylori; S. s., Streptococcus sanguinis; C. c., Caulobacter crescentus; B. s., Bacillus subtilis; E. c., E. coli; P. a., Pseudomonas aeruginosa. See Materials and Methods for specific genome identities. Average gene conservation is specified as a percentage. Average gene conservation values are reduced by the fraction of their predicted protein-coding genes not present in eggNOG v.3 to account for genes without predicted orthology. To produce OG conservation instead of locus conservation, all but one locus of a set of potential paralogs (in this case, genes sharing the same OG) was removed prior to calculating averages. A logarithmic regression is fitted to both sets of values. Average OG conservation values are also shown for subsets of protein-coding genes present within protein complexes from E. coli [5] and M. pneumoniae [6]. For these two species, values are representative of members in full complexomes while those for other species are predicted complexomes using each of the three data sets as models.

