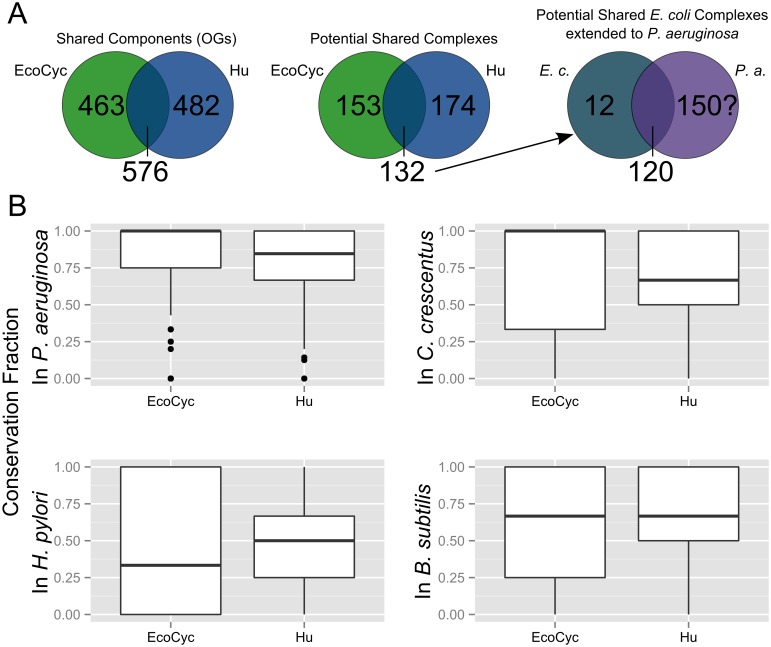
Fig 3. Protein complex sets vary in conservation across bacteria.
(A) Overlap between literature-curated (EcoCyc) and experimentally-observed (Hu et al.) E. coli complex sets is limited. Each data set contains unique proteins, even when all are mapped to orthologous groups (far left). Each complex in one of the two E. coli complex sets may or may not appear to be shared in the other complex set (middle; a potentially shared complex must have at least half of its components in at least one complex in both sets). Using just the set of complexes shared between the two E. coli sets as a model for predicting complexomes in other species (far right; in this case, P. aeruginosa is used as an example) may be limiting. 12 complexes from the shared set appear to be conserved in P. aeruginosa but roughly an additional 150 complexes may be expected based on those seen in E. coli. (B) Each box plot displays the range of conservation fractions of E. coli protein complexes from the literature curated (EcoCyc) and experimental (Hu et al.) sets with respect to a species other than E. coli. The upper and lower edges of each box correspond to the first and third quartile of conservation fraction values, respectively. The upper whisker corresponds to the highest value within 1.5 times the inter-quartile range (IQR) while the lower whisker corresponds to the lowest value within the same range. Data points outside 1.5 times IQR are represented by single data points.

