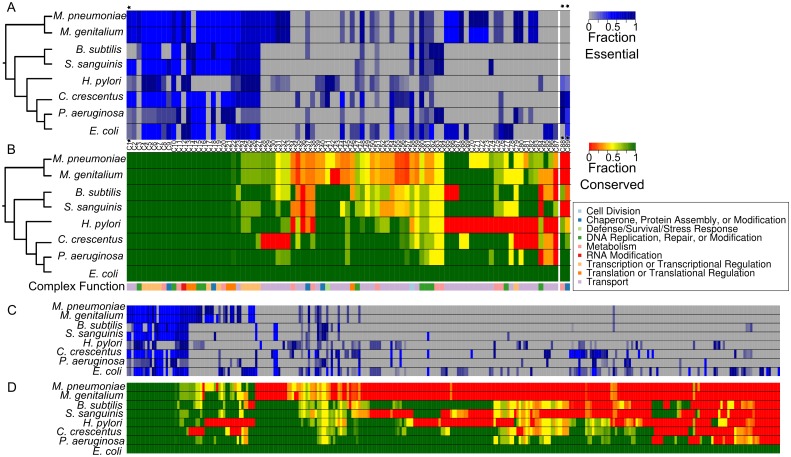
Fig 5. Fractional essentiality and conservation of protein complexes across species.
(A) Each column represents one protein complex (as defined in EcoCyc for E. coli) and its fraction of essentiality within the species shown at left. This subset of complexes are those in which at least one component is predicted to be conserved in M. pneumoniae. Black stars by complex IDs indicate complexes shown in Fig. 3. Two example complexes not predicted to be present in M. pneumoniae are also shown at the far right of the complex list. See S1 Table for key to complexes. For species other than E. coli, complexes are predicted using orthologous groups (OGs). Colors indicate the fraction of essentiality: blue—conserved components are essential at the fraction specified at right, grey—no components are conserved or all conserved components are not essential. (B) Conservation of complexes as shown in (A). Colors indicate the fraction of conservation ranging from dark green (all proteins are present) to red (no protein is present). General functional group assignments were manually assigned based on EcoCyc annotations. Columns in panels A and B correspond to the same complexes. (C) As in part A, but for the full set of EcoCyc E. coli complexes; each column is a single complex. An extended version of this heat map is provided in S1 Fig. (D) As in part B, but for the full set of EcoCyc E. coli complexes; each column is a single complex. The order of complexes is identical to that in (C). An extended version of this heat map is provided in S2 Fig. Columns in panels C and D correspond to the same complexes.

