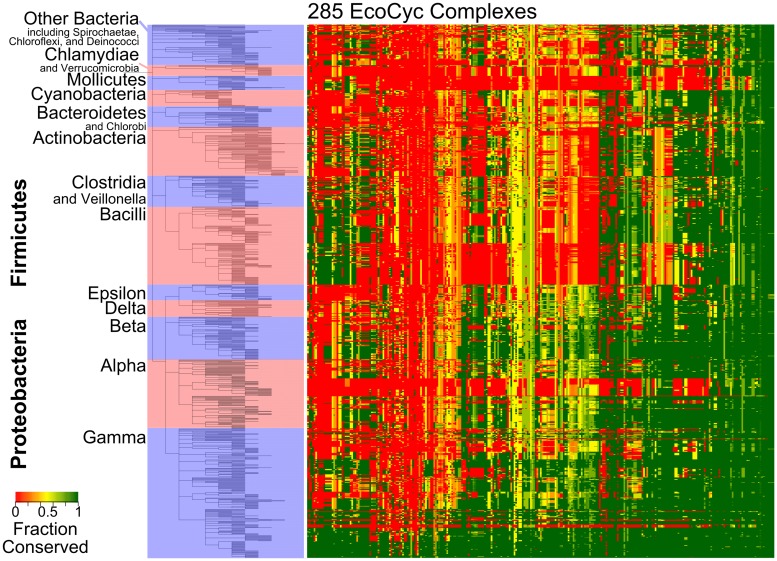
Fig 6. E. coli complex conservation across Bacteria corresponds to taxonomic boundaries.
The heat map displays fractional conservation of all 285 EcoCyc protein complexes as in Fig. 5, though in this case across 894 different bacterial genomes as indicated on the tree at left. See Materials and Methods for taxonomic details. Specific complex names and species/strain names may be found in S5 Fig. Complexes (columns) have been clustered on the basis of the distance between their average fractional conservations (average linkage).

