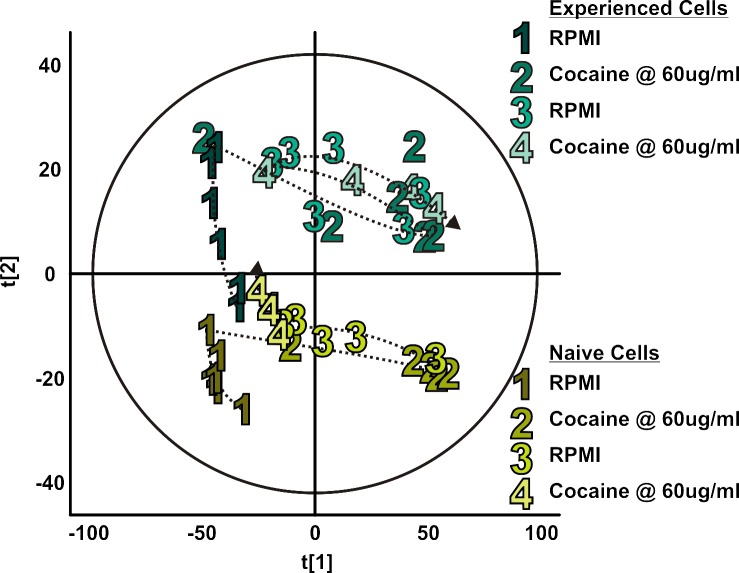
Fig 5. Exometabolomic profiles of naïve and cocaine-experienced Jurkat T cells from online cellular analysis.
Walking principal component analyses of exometabolomic profiles of naïve (shades of yellow) and cocaine-experienced (shades of turquoise) Jurkat T cells were constructed following online cellular analysis. Each numerically labeled data point represents a 9-minute column elution, with six data points collected per step (all marked with the step number and connected in order of collection with the dotted line). In steps 1 and 3, both cell populations received plain RPMI. In steps 2 and 4, both received cocaine in RPMI at 60 μg/mL. As profiles switch from RPMI to cocaine exposure, the data points move towards the right and vice versa, with the exception of naïve cell step 4, which stays closer to step 1. Further analysis of the data reveals this inconsistency may be explained by the death of the cells. Data were grouped not only based on the experimental step, but also by the experience level of the cells, as the cells receiving a 4-hour pre-incubation in cocaine group separately from those that did not receive this dose.

