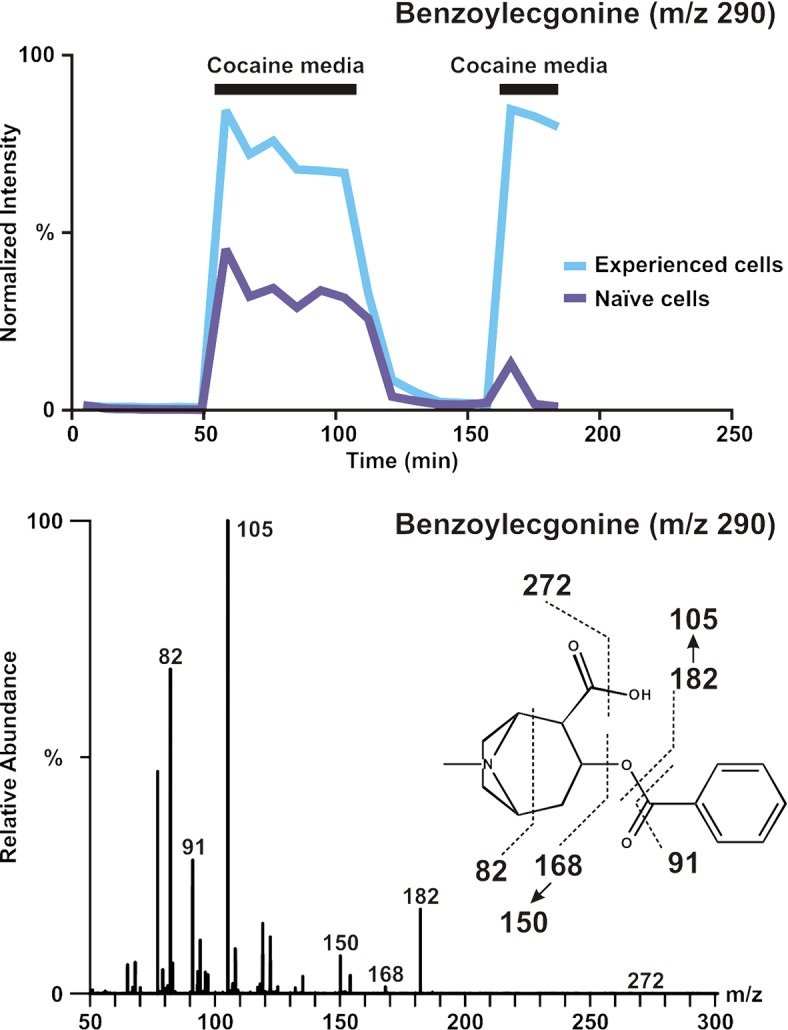
Fig 6. Benzoylecgonine (BE) time course and fragmentation data.

Top: BE time course data for experienced (blue) and naïve (purple) cells. While data were gathered sequentially, plots are overlaid to highlight the increased abundance of BE in experienced cells. The absence of the expected increase in BE corresponding to step 4 (the last step of cocaine exposure) suggests a decrease in cocaine metabolism, possibly due to cell death. Bottom: The fragmentation spectra of BE are shown with parent ion of m/z 290.
