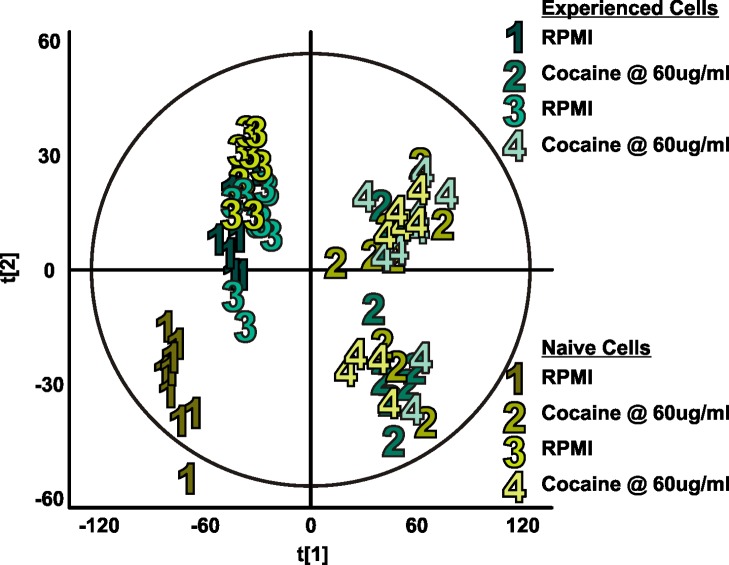
Fig 9. Exometabolomic profiles of naïve and cocaine-experienced Jurkat T cells from in-culture analysis.
Walking principal component analysis of exometabolomic profiles of naïve (shades of yellow) and cocaine-experienced (shades of turquoise) Jurkat T cells using in-culture analysis. Each numerically labeled data point represents the end point of a 54-minute exposure to the indicated media. As with the online experiment, during steps 1 and 3 both cell populations received plain RPMI, while during steps 2 and 4 both received cocaine in RPMI at 60 μg/mL. Variance between steps 1 and 3 and steps 2 and 4 results in unsupervised grouping according to media exposure type. Separation between naïve and experienced cell groups, particularly when under cocaine exposure, does not occur to the same degree, as yellow and turquoise points corresponding to steps 2 and 4 are heavily intermixed.

