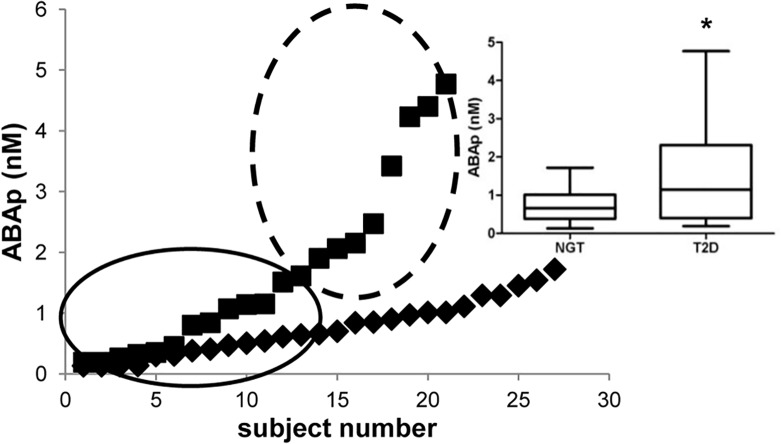
Fig 2. Fasting ABAp in NGT subjects and T2D patients.
Fasting ABAp was determined by HPLC-MS in 21 male T2D patients (squares) and in 27 sex-, age- and BMI-matched NGT subjects (rhombi). Results are ordered by increasing value. The circled areas indicate the possible existence of two sub-groups within the T2D patients, one with higher-than-normal ABAp levels and one with ABAp values similar to those of the NGT group. Inset: a box-and-whisker plot drawn from the same data sets. * p = 0.013

