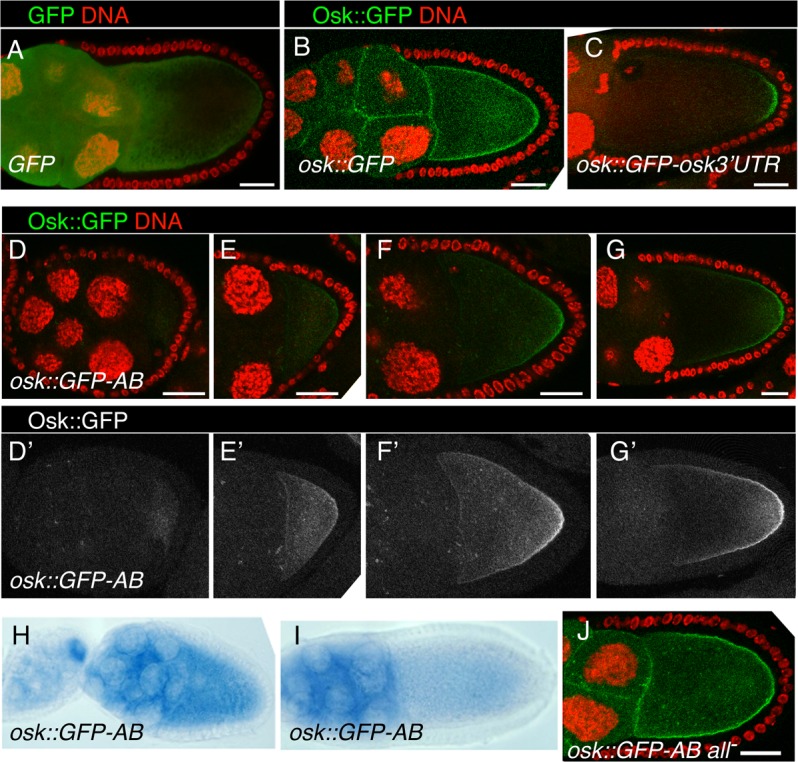
Fig 6. Regional inhibition of Bru repression.

A-C. Distribution of GFP fluorescence from UAS-GFP (A), UAS-osk1–534::GFP (B) and UAS-osk1–534::GFP-osk3′UTR (C). For this and all panels except D′-G′ and H and I, GFP fluorescence is green and DNA (ToPro-3 staining) is red. For all panels, transgene expression was driven with the matα4-GAL-VP16 driver and scale bars are 25 μm. D-G. Distribution of GFP fluorescence from UAS-osk1–534::GFP-AB at progressively later stages of oogenesis. In panels D′-G′, only the GFP channel is shown, with the signal enhanced (identically for all) in Adobe Photoshop to better reveal loss of repression in the oocyte. At the earliest stage shown (D,D′), there is a very low level of Osk1–534::GFP distributed throughout the oocyte. Later, the oocyte signal increases, initially ungraded (E,E′) and later clearly in a gradient from the posterior (F,F′,G,G′). H,I. Distribution of osk1–534::GFP-AB mRNA, detected by in situ hybridization. mRNA signal is blue. J. Loss of translational repression from UAS-osk1–534::GFP-AB all-. No posterior gradient of GFP can be detected.
